Exhibit 99.4
Investor Presentation July 2024
Basis of Presentation This presentation (this “Presentation”) is provided for informational purposes only and has been prepared to assist interested parties in making their own evaluation with respect to an investment opportunity in Bridger Aerospace Group Holdings, Inc . (“Bridger”, “Bridger Aerospace” or the “Company”) and for no other purpose . By accepting, reviewing or reading this Presentation, you will be deemed to have agreed to the obligations and restrictions set out below . No Offer or Solicitation This Presentation and any oral statements made in connection with this Presentation do not constitute an offer to sell, or a solicitation of an offer to buy, or a recommendation to purchase, any securities in any jurisdiction, nor shall there be any sale, issuance or transfer of any securities in any jurisdiction where, or to any person to whom, such offer, solicitation or sale may be unlawful under the laws of such jurisdiction . This Presentation does not constitute either advice or a recommendation regarding any securities . No offering of securities shall be made except by means of a prospectus meeting the requirements of the Securities Act of 1933 , as amended, or an exemption therefrom . Industry and Market Data No representations or warranties, express, implied or statutory are given in, or in respect of, this Presentation, and no person may rely on the information contained in this Presentation . To the fullest extent permitted by law, in no circumstances will Bridger or any of its respective subsidiaries, stockholders, affiliates, representatives, partners, directors, officers, employees, advisers or agents be responsible or liable for any direct, indirect or consequential loss or loss of profit arising from the use of this Presentation, its contents, its omissions, reliance on the information contained within it or on opinions communicated in relation thereto or otherwise arising in connection therewith . This Presentation discusses trends and markets that Bridger’s leadership team believes will impact the development and success of Bridger based on its current understanding of the marketplace . Industry and market data used in this Presentation have been obtained from third - party industry publications and sources as well as from research reports prepared for other purposes . Bridger has not independently verified the data obtained from these sources and cannot assure you of the reasonableness of any assumptions used by these sources or the data’s accuracy or completeness . Any data on past performance or modeling contained herein is not an indication as to future performance . This data is subject to change . Recipients of this Presentation are not to construe its contents, or any prior or subsequent communications from Bridger or its respective representatives as investment, legal or tax advice . The Recipient should seek independent third party legal, regulatory, accounting and/or tax advice regarding this Presentation . In addition, this Presentation does not purport to be all - inclusive or to contain all of the information that may be required to make a full analysis of Bridger . Recipients of this Presentation should each make their own evaluation of Bridger and of the relevance and adequacy of the information and should make such other investigations as they deem necessary . Bridger assumes no obligation to update the information in this Presentation . 2 Important Disclaimers
Important Disclaimers Forward Looking Statements Certain statements included in this Presentation are not historical facts but are forward - looking statements, including for purposes of the safe harbor provisions under the United States Private Securities Litigation Reform Act of 1995 . Forward - looking statements generally are accompanied by words such as “believe,” “may,” “will,” “estimate,” “continue,” “anticipate,” “intend,” “expect,” “should,” “would,” “plan,” “project,” “forecast,” “predict,” “poised,” “positioned,” “potential,” “seem,” “seek,” “future,” “outlook,” “target,” and similar expressions that predict or indicate future events or trends or that are not statements of historical matters, but the absence of these words does not mean that a statement is not forward - looking . These forward - looking statements include, but are not limited to, ( 1 ) the ultimate outcome and benefits of the acquisition of FMS, including operational synergies and the ability to target certain types of contracts ; ( 2 ) the forecasted payback period for new Super Scoopers ; ( 3 ) increases in demand for Bridger’s services, including funding for wildfire control and aerial firefighting ; ( 4 ) the anticipated expansion of Bridger’s operations and increased deployment of Bridger’s aircraft fleet, including references to Bridger’s acquisition of and/or right to use the four Super Scoopers acquired from the government of Spain by a subsidiary of MAB Funding, LLC (“MAB JV”) a joint venture entity partially owned by Bridger, including the timings thereof=and the anticipated benefits therefrom ; ( 5 ) Bridger’s business, product development, operations and growth plans, including anticipated revenue, net income, Adjusted EBITDA and Adjusted EBITDA per Scooper for 2024 ; ( 6 ) the types of services Bridger may offer ; and ( 7 ) Bridger’s capital expenditures and acquisitions strategies, including anticipated investments in additional aircraft, capital resources, and research and development and the effect of these investments . These statements are based on various assumptions and estimates, whether or not identified in this Presentation, and on the current expectations of Bridger’s management and are not predictions of actual performance . These forward - looking statements are provided for illustrative purposes only and are not intended to serve as, and must not be relied on by any investor as, a guarantee, an assurance, a prediction or a definitive statement of fact or probability . Actual events and circumstances are difficult or impossible to predict and will differ from assumptions . Many actual events and circumstances are beyond the control of Bridger . These forward - looking statements are subject to a number of risks and uncertainties, including : Bridger’s ability to identify and effectively implement any current or future anticipated cost reductions, including any resulting impacts to Bridger’s business and operations therefrom ; the duration or severity of any domestic or international wildfire seasons ; changes in domestic and foreign business, market, financial, political and legal conditions ; Bridger’s failure to realize the anticipated benefits of any acquisitions, including FMS ; Bridger’s successful integration of FMS, or any other acquisition or aircraft (including achievement of synergies and cost reductions) ; the ability of Bridger to provide services to certain new customers, and Bridger’s success in securing contracts to perform these services ; Bridger’s ability to successfully and timely develop, sell and expand its services, and otherwise implement its growth strategy ; risks relating to Bridger’s operations and business, including information technology and cybersecurity risks, loss of requisite licenses, flight safety risks, loss of key customers and deterioration in relationships between Bridger and its employees ; risks related to increased competition ; risks relating to potential disruption of current plans, operations and infrastructure of Bridger, including as a result of the consummation of any acquisition, including FMS ; risks that Bridger is unable to secure or protect its intellectual property ; risks that Bridger experiences difficulties managing its growth and expanding operations ; Bridger's ability to compete with existing or new companies that could cause downward pressure on prices, fewer customer orders, reduced margins, the inability to take advantage of new business opportunities, and the loss of market share ; and the ability to successfully select, execute or integrate future acquisitions into Bridger's business, which could result in material adverse effects to operations and financial conditions . Forward - looking statements are also subject to the risk factors and cautionary language described from time to time in the reports Bridger files with the U . S . Securities and Exchange Commission, including those in Bridger’s most recent Annual Report on Form 10 - K and any updates thereto in Bridger’s Quarterly Reports on Form 10 - Q and Current Reports on Form 8 - K . If any of these risks materialize or Bridger management’s assumptions prove incorrect, actual results could differ materially from the results implied by these forward - looking statements . The risks and uncertainties above are not exhaustive, and there may be additional risks that Bridger presently does not know or that Bridger currently believes are immaterial that could also cause actual results to differ from those contained in the forward - looking statements . In addition, forward - looking statements reflect Bridger’s expectations, plans or forecasts of future events and views as of the date of this Presentation . Bridger anticipates that subsequent events and developments will cause Bridger’s assessments to change . However, while Bridger may elect to update these forward - looking statements at some point in the future, Bridger specifically disclaims any obligation to do so . These forward - looking statements should not be relied upon as representing Bridger’s assessments as of any date subsequent to the date of this Presentation . Accordingly, undue reliance should not be placed upon the forward - looking statements contained in this Presentation . Trademarks Bridger owns or has rights to various trademarks, service marks and trade names that its uses in connection with the operation of its business . This Presentation also contains trademarks, service marks, trade names and copyrights of third parties, which are the property of their respective owners . The use or display of third parties’ trademarks, service marks, trade names or products in this Presentation is not intended to, and does not imply, a relationship with Bridger, an endorsement or sponsorship by or of Bridger, or a guarantee the Bridger will work or will continue to work with such third parties . Solely for convenience, the trademarks, service marks, trade names and copyrights referred to in this Presentation may appear without the TM, SM, ® or © symbols, but such references are not intended to indicate, in any way, that Bridger or any third - party will not assert, to the fullest extent under applicable law, their rights or the right of the applicable licensor to these trademarks, service marks, trade names and copyrights . 3
Important Disclaimers Non - GAAP Financial Measures Some of the financial information and data contained in this Presentation, such as Adjusted EBITDA (“Adj . EBITDA”), Adjusted EBITDA margin (“Adj . EBITDA margin”), Adjusted EBITDA per Scooper, Growth Capital Expenditures (“Growth CapEx”), Maintenance and Miscellaneous Capital Expenditures (“Maintenance and Miscellaneous CapEx”) and Free Cash Flow, have not been prepared in accordance with United States generally accepted accounting principles (“GAAP”) . Adjusted EBITDA is defined as net earnings (loss) before interest expense, income tax expense (benefit), depreciation and amortization, as adjusted to exclude non - cash items or certain transactions that management does not believe are indicative of ongoing Company operating performance, such as non - cash stock - based compensation, business development and integration costs, offering costs, loss on disposals and non - cash impairment charges, changes in fair value of earnout consideration, changes in fair value of outstanding warrants, loss on extinguishment of debt, and non - recurring discretionary bonuses to employees and executives . Adjusted EBITDA per Scooper is defined as the average net earnings (loss) per Super Scooper before interest expense, income tax expense (benefit), depreciation and amortization . These non - GAAP financial measures, and other measures that are calculated using such non - GAAP measures, are an addition to, and not a substitute for or superior to, measures of financial performance prepared in accordance with GAAP and should not be considered as an alternative to revenue, operating income, profit before tax, net income or any other performance measures derived in accordance with GAAP . A reconciliation of the projected non - GAAP financial measures has not been provided and is unable to be provided without unreasonable effort because certain items excluded from these non - GAAP financial measures cannot be reasonably calculated or predicted at this time . For the same reasons, Bridger is unable to address the probable significance of the unavailable information, which could be material to future results . Although Bridger believes that net income or loss, as determined in accordance with GAAP, is the most appropriate earnings measure, Bridger uses EBITDA and Adjusted EBITDA as key profitability measures to assess the performance of its business . Bridger believes these measures help illustrate underlying trends in its business and use the measures to establish budgets and operational goals, and communicate internally and externally, in managing its business and evaluating its performance . Bridger also believes these measures help investors compare its operating performance with its results in prior periods in a way that is consistent with how Bridger management evaluates such performance . Neither EBITDA or Adjusted EBITDA are recognized under GAAP and do not purport to be an alternative to net income or loss determined in accordance with GAAP as a measure of Bridger’s performance . Such measures have limitations as analytical tools, and should not be considered in isolation or as substitutes for Bridger’s results as reported under GAAP . EBITDA and Adjusted EBITDA exclude items that can have a significant effect on Bridger’s profit or loss and should, therefore, be used only in conjunction with Bridger’s GAAP profit or loss for the period . Bridger management compensates for the limitations of using non - GAAP financial measures by using them to supplement GAAP results to provide a more complete understanding of the factors and trends affecting the business than GAAP results alone . Because not all companies use identical calculations, these measures may not be comparable to other similarly titled measures of other companies . See the final slide in this presentation for reconciliations of these non - GAAP financial measures to the most directly comparable GAAP measures . Use of Projections This Presentation contains projected financial information with respect to Bridger, namely revenue, Adjusted EBITDA and Adjusted EBITDA per Scooper for 2024 . Such projected financial information constitutes forward - looking information for illustrative purposes only and should not be relied upon as necessarily being indicative of future results . The projections, estimates and targets in this Presentation are forward - looking statements that are based on assumptions that are inherently subject to significant uncertainties and contingencies, many of which are beyond Bridger’s control . See “Forward - Looking Statements” above . The assumptions and estimates underlying the projected, expected or target results are inherently uncertain and are subject to a wide variety of significant business, weather, economic, regulatory, competitive, technological, and other risks and uncertainties that could cause actual results to differ materially from those contained in such projections, estimates and targets . The inclusion of projections, estimates and targets in this Presentation should not be regarded as an indication that Bridger, or their representative, considered or consider the financial projections, estimates and targets to be a reliable prediction of future events . The independent registered public accounting firm of Bridger has not audited, reviewed, compiled or performed any procedures with respect to the projections for the purpose of their inclusion in this Presentation, and accordingly, neither of them expressed an opinion or provided any other form of assurance with respect thereto for the purpose of this Presentation . 4

Today’s Agenda Introduction to Bridger Aerial Firefighting Industry Overview Business Model Growth Drivers Financial Profile 5
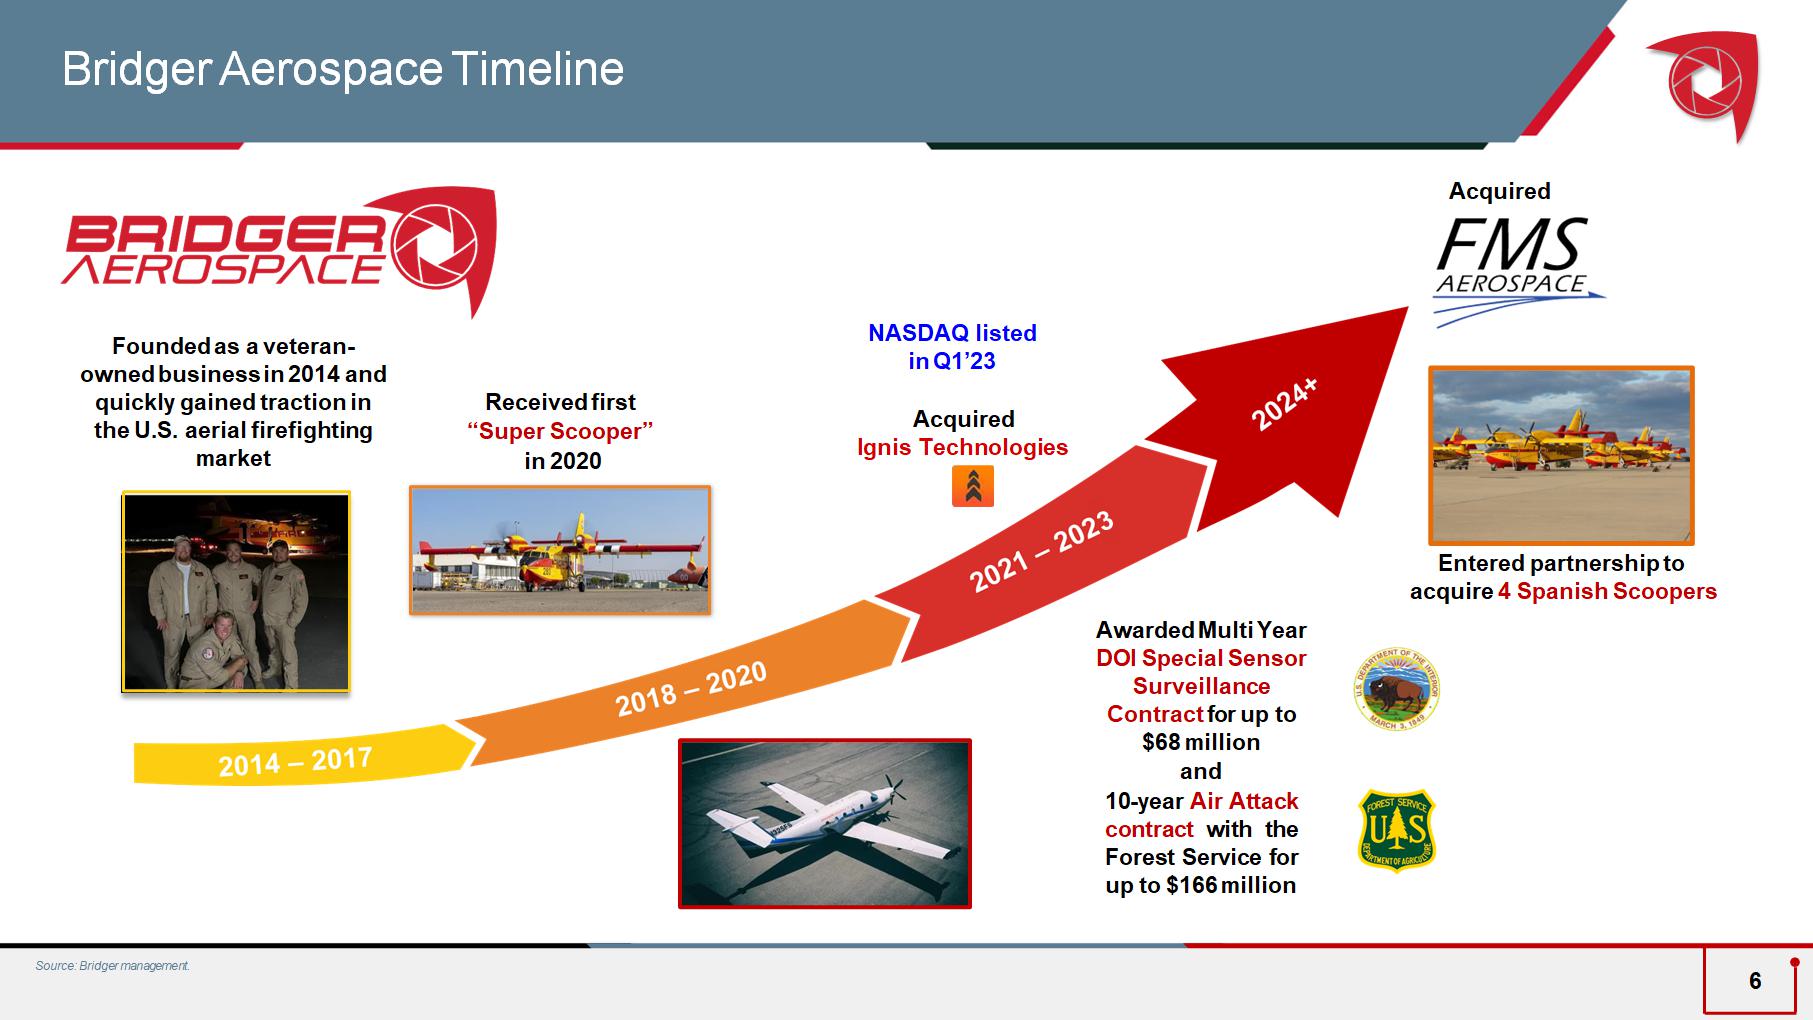
Bridger Aerospace Timeline Founded as a veteran - owned business in 2014 and quickly gained traction in the U.S. aerial firefighting market Awarded Multi Year DOI Special Sensor Surveillance Contract for up to $68 million and 10 - year Air Attack contract with the Forest Service for up to $ 166 million NASDAQ listed in Q1’23 Received first “Super Scooper” in 2020 Source: Bridger management. Entered partnership to acquire 4 Spanish Scoopers Acquired Ignis Technologies 6 Acquired
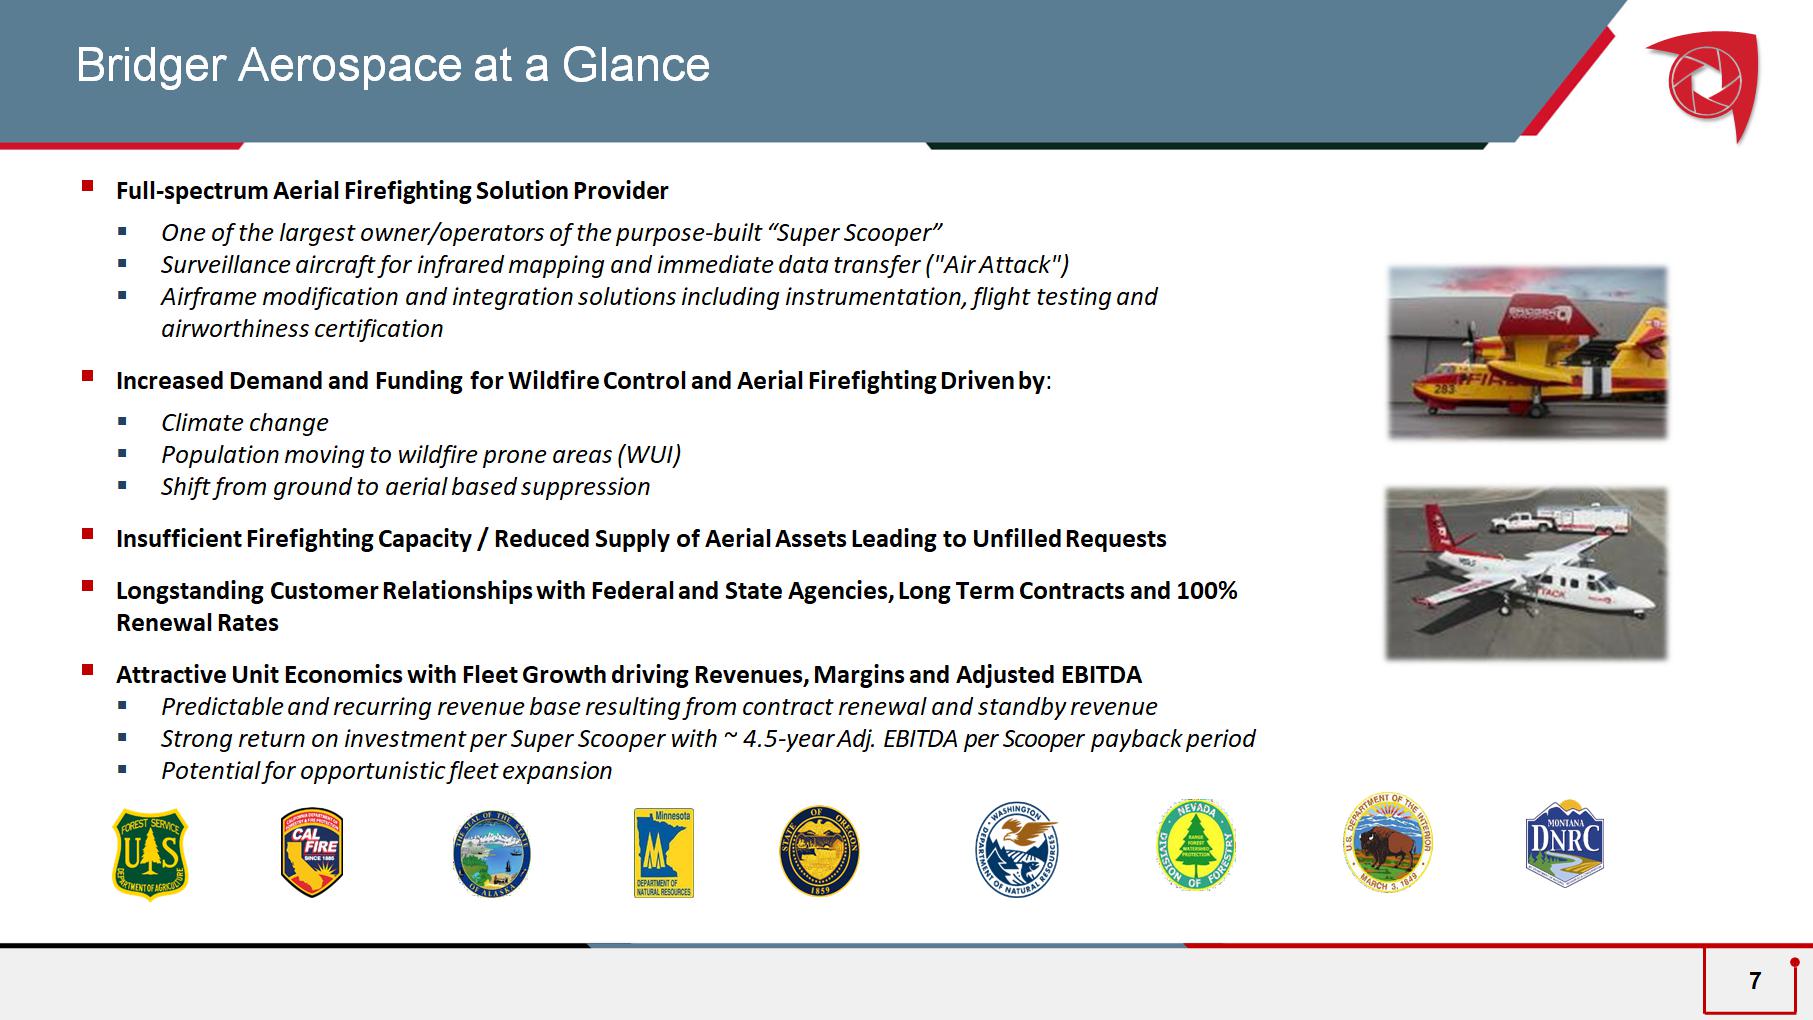
Bridger Aerospace at a Glance ▪ Full - spectrum Aerial Firefighting Solution Provider ▪ One of the largest owner/operators of the purpose - built “ Super Scooper” ▪ Surveillance aircraft for infrared mapping and immediate data transfer ( " Air Attack " ) ▪ Airframe modification and integration solutions including instrumentation, flight testing and airworthiness certification ▪ Increased Demand and Funding for Wildfire Control and Aerial Firefighting Driven by : ▪ Climate change ▪ Population moving to wildfire prone areas (WUI) ▪ Shift from ground to aerial based suppression ▪ Insufficient Firefighting Capacity / Reduced Supply of Aerial Assets Leading to Unfilled Requests ▪ Longstanding Customer Relationships with Federal and State Agencies, Long Term Contracts and 100% Renewal Rates ▪ Attractive Unit Economics with Fleet Growth driving Revenues, Margins and Adjusted EBITDA ▪ Predictable and recurring revenue base resulting from contract renewal and standby revenue ▪ Strong return on investment per Super Scooper with ~ 4.5 - year Adj. EBITDA per Scooper payback period ▪ Potential for opportunistic fleet expansion 7
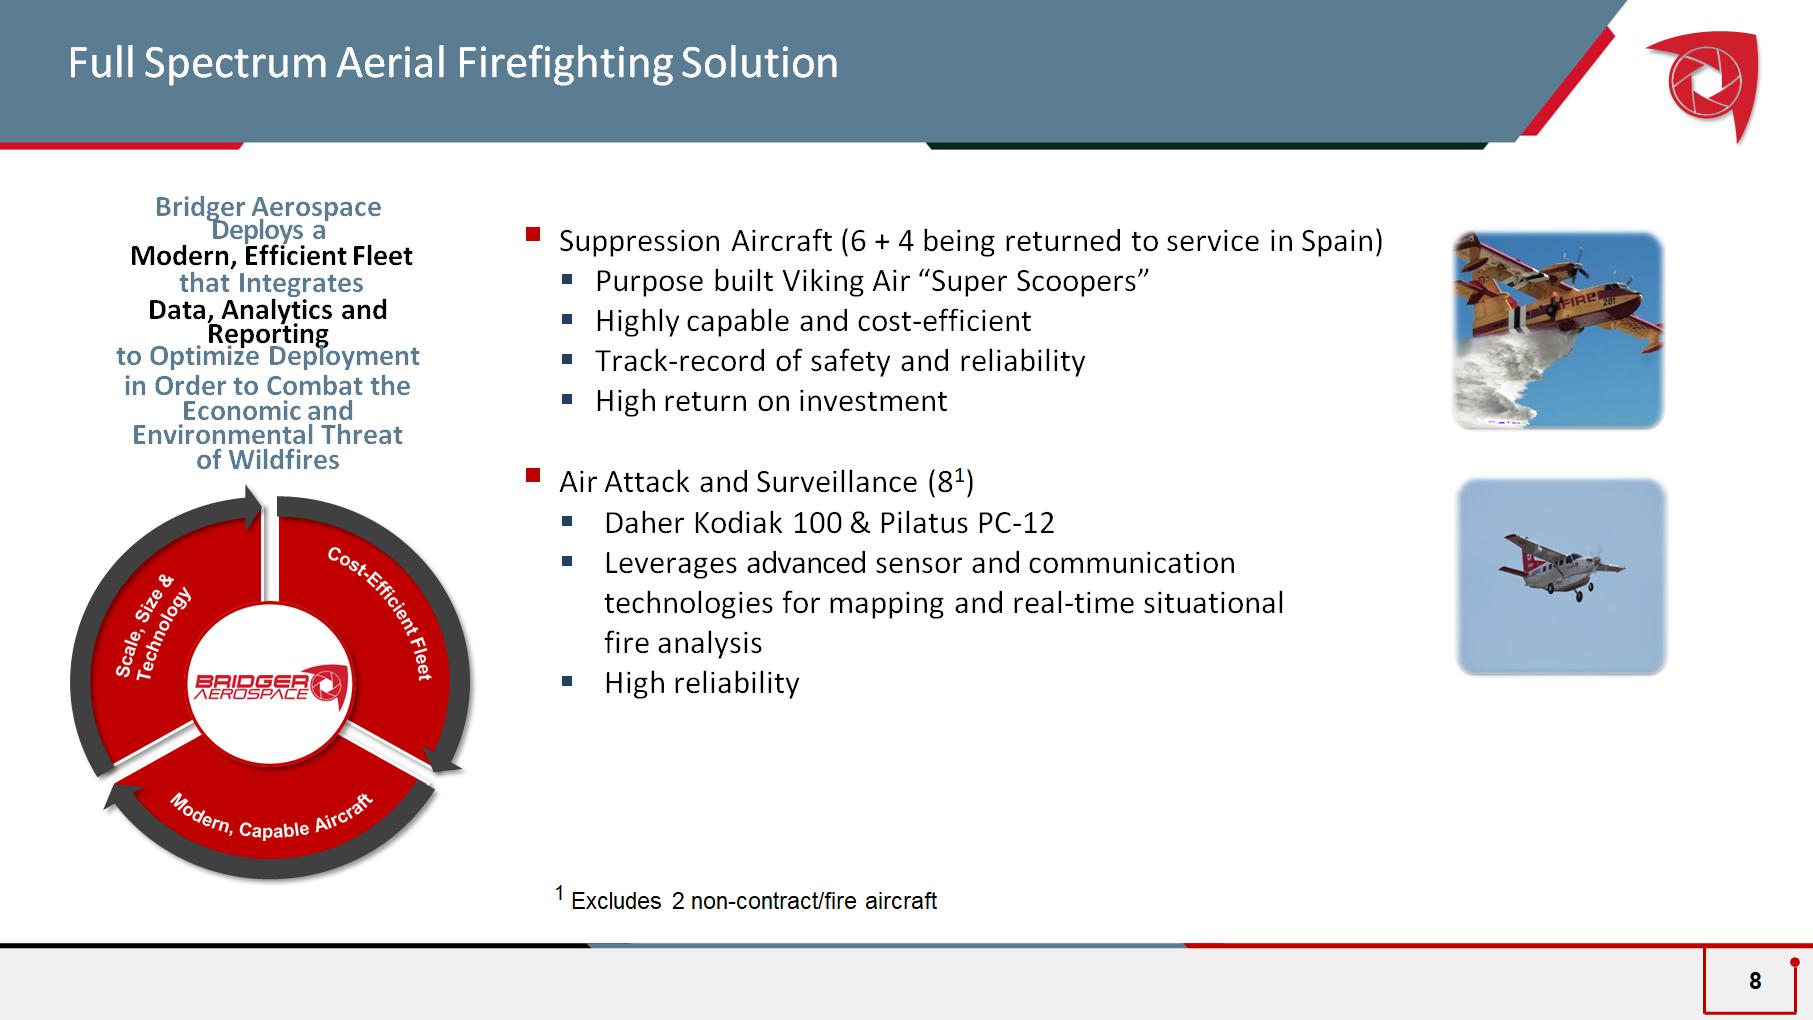
Full Spectrum Aerial Firefighting Solution ▪ Suppression Aircraft (6 + 4 being returned to service in Spain) ▪ Purpose built Viking Air “Super Scoopers” ▪ Highly capable and cost - efficient ▪ Track - record of safety and reliability ▪ High return on investment ▪ Air Attack and Surveillance (8 1 ) ▪ Daher Kodiak 100 & Pilatus PC - 12 ▪ Leverages advanced sensor and communication technologies for mapping and real - time situational fire analysis ▪ High reliability Bridger Aerospace Deploys a Modern, Efficient Fleet that Integrates Data, Analytics and Reporting to Optimize Deployment in Order to Combat the Economic and Environmental Threat of Wildfires 8 1 Excludes 2 non - contract/fire aircraft
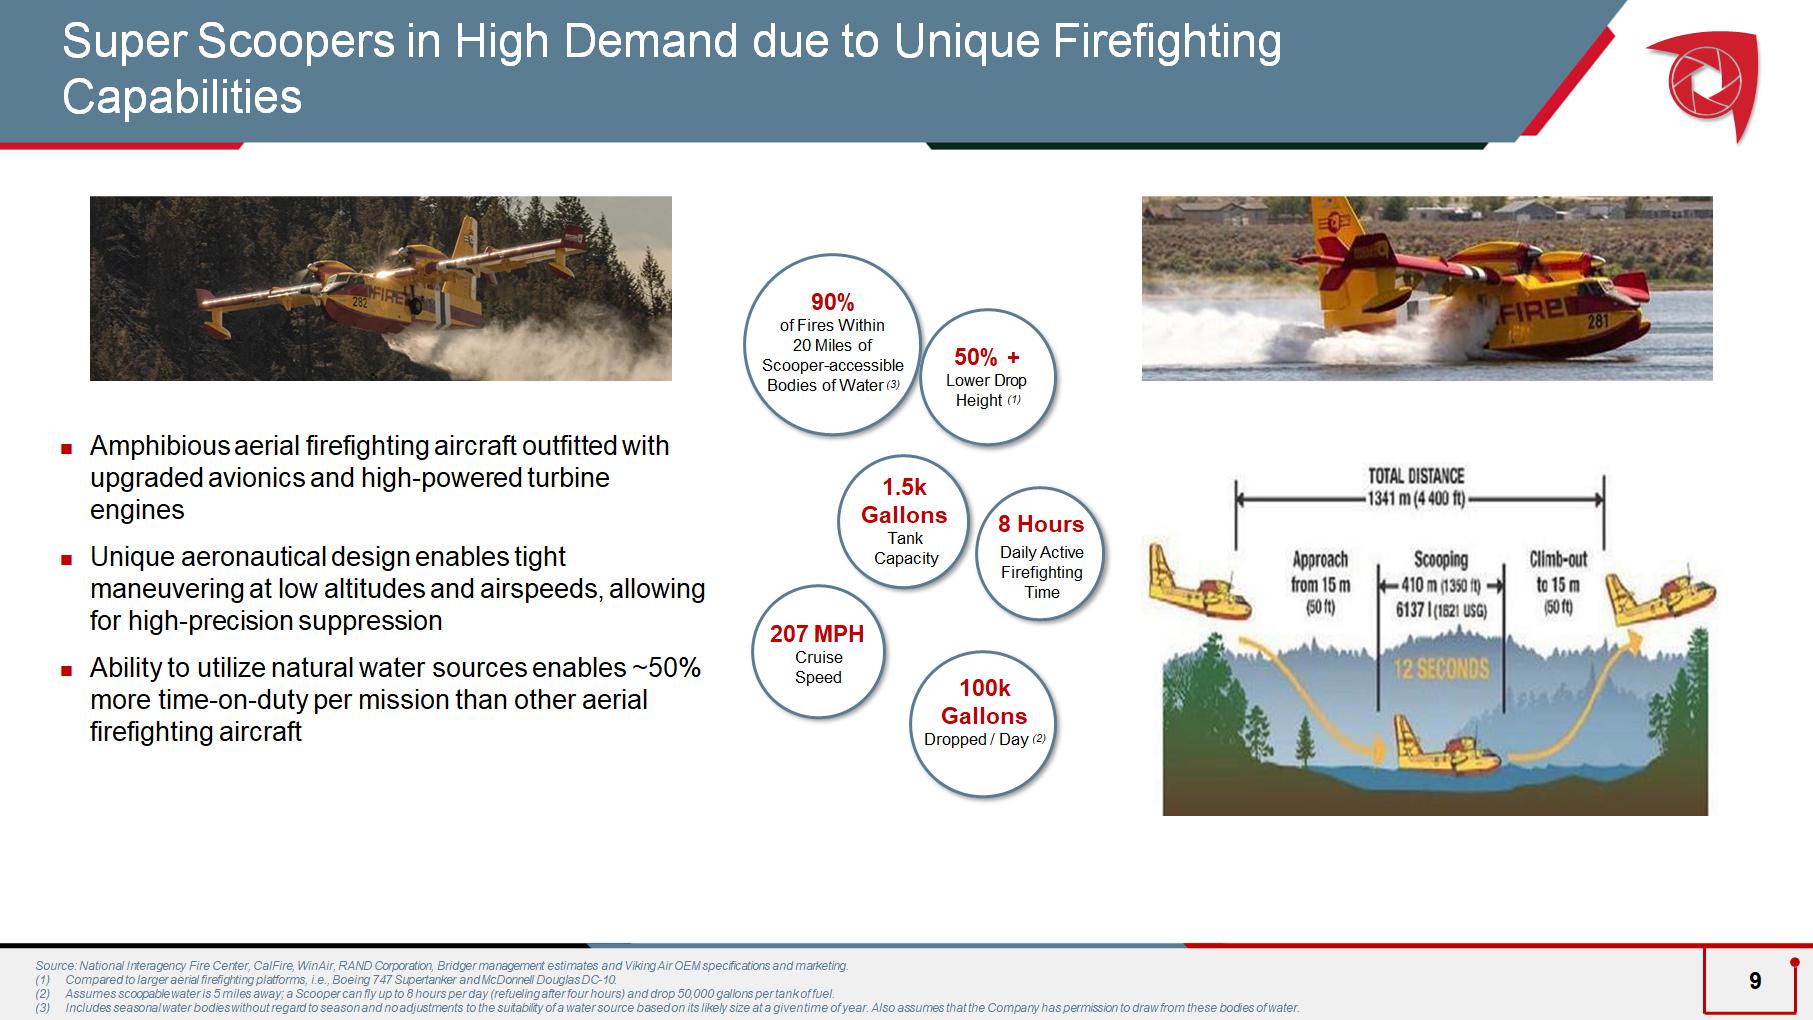
Source: National Interagency Fire Center, CalFire, WinAir, RAND Corporation, Bridger management estimates and Viking Air OEM specifications and marketing. (1) Compared to larger aerial firefighting platforms, i.e., Boeing 747 Supertanker and McDonnell Douglas DC - 10. (2) Assumes scoopable water is 5 miles away; a Scooper can fly up to 8 hours per day (refueling after four hours) and drop 50,000 gallons per tank of fuel. (3) Includes seasonal water bodies without regard to season and no adjustments to the suitability of a water source based on its likely size at a given time of year. Also assumes that the Company has permission to draw from these bodies of water. Amphibious aerial firefighting aircraft outfitted with upgraded avionics and high - powered turbine engines; Unique aeronautical design enables tight maneuvering at low altitudes and airspeeds, allowing for high - precision suppression; Ability to utilize natural water sources enables ~50% more time - on - duty per mission than other aerial firefighting aircraft 207 MPH Cruise Speed 8 Hours Daily Active Firefighting Time 1.5k Gallons Tank Capacity 90% of Fires Within 20 Miles of Scooper - accessible Bodies of Water (3) 100k Gallons Dropped / Day (2) 50% + Lower Drop Height (1) Super Scoopers in High Demand due to Unique Firefighting Capabilities 9
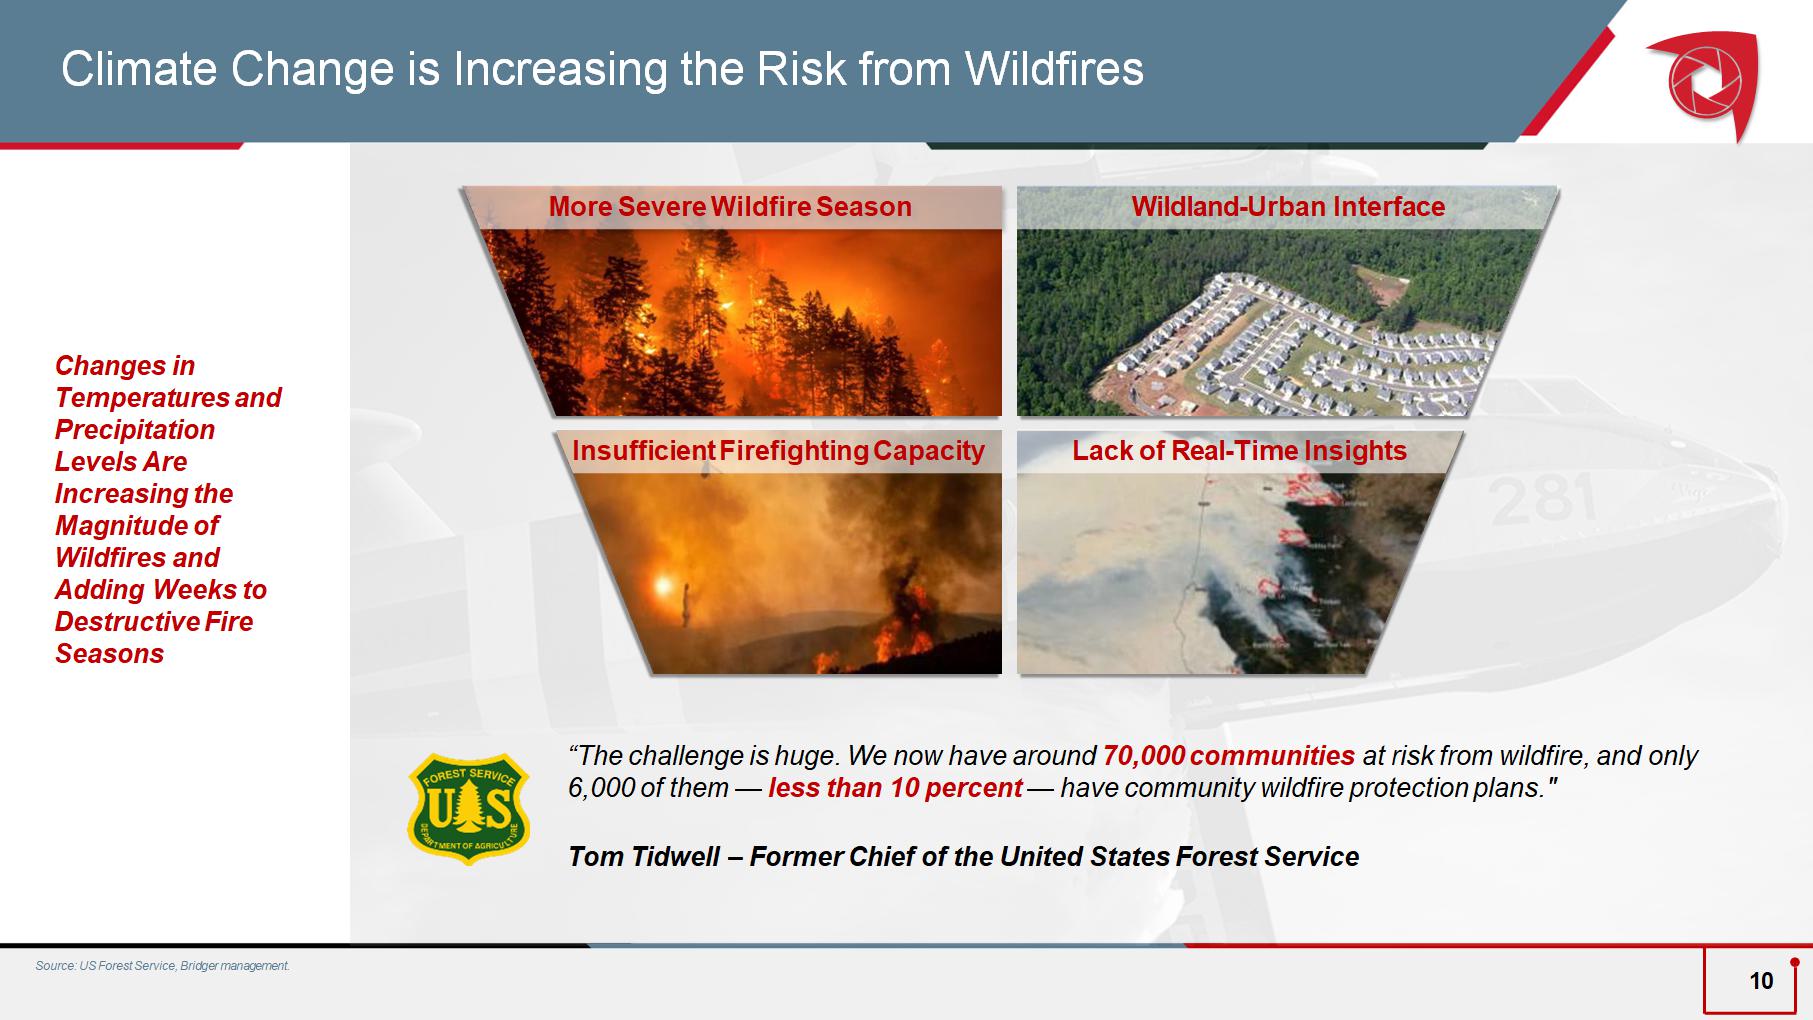
More Severe Wildfire Season Lack of Real - Time Insights “The challenge is huge. We now have around 70,000 communities at risk from wildfire, and only 6,000 of them — less than 10 percent — have community wildfire protection plans." Tom Tidwell – Former Chief of the United States Forest Service Changes in Temperatures and Precipitation Levels Are Increasing the Magnitude of Wildfires and Adding Weeks to Destructive Fire Seasons Insufficient Firefighting Capacity Wildland - Urban Interface Climate Change is Increasing the Risk from Wildfires Source: US Forest Service, Bridger management. 10
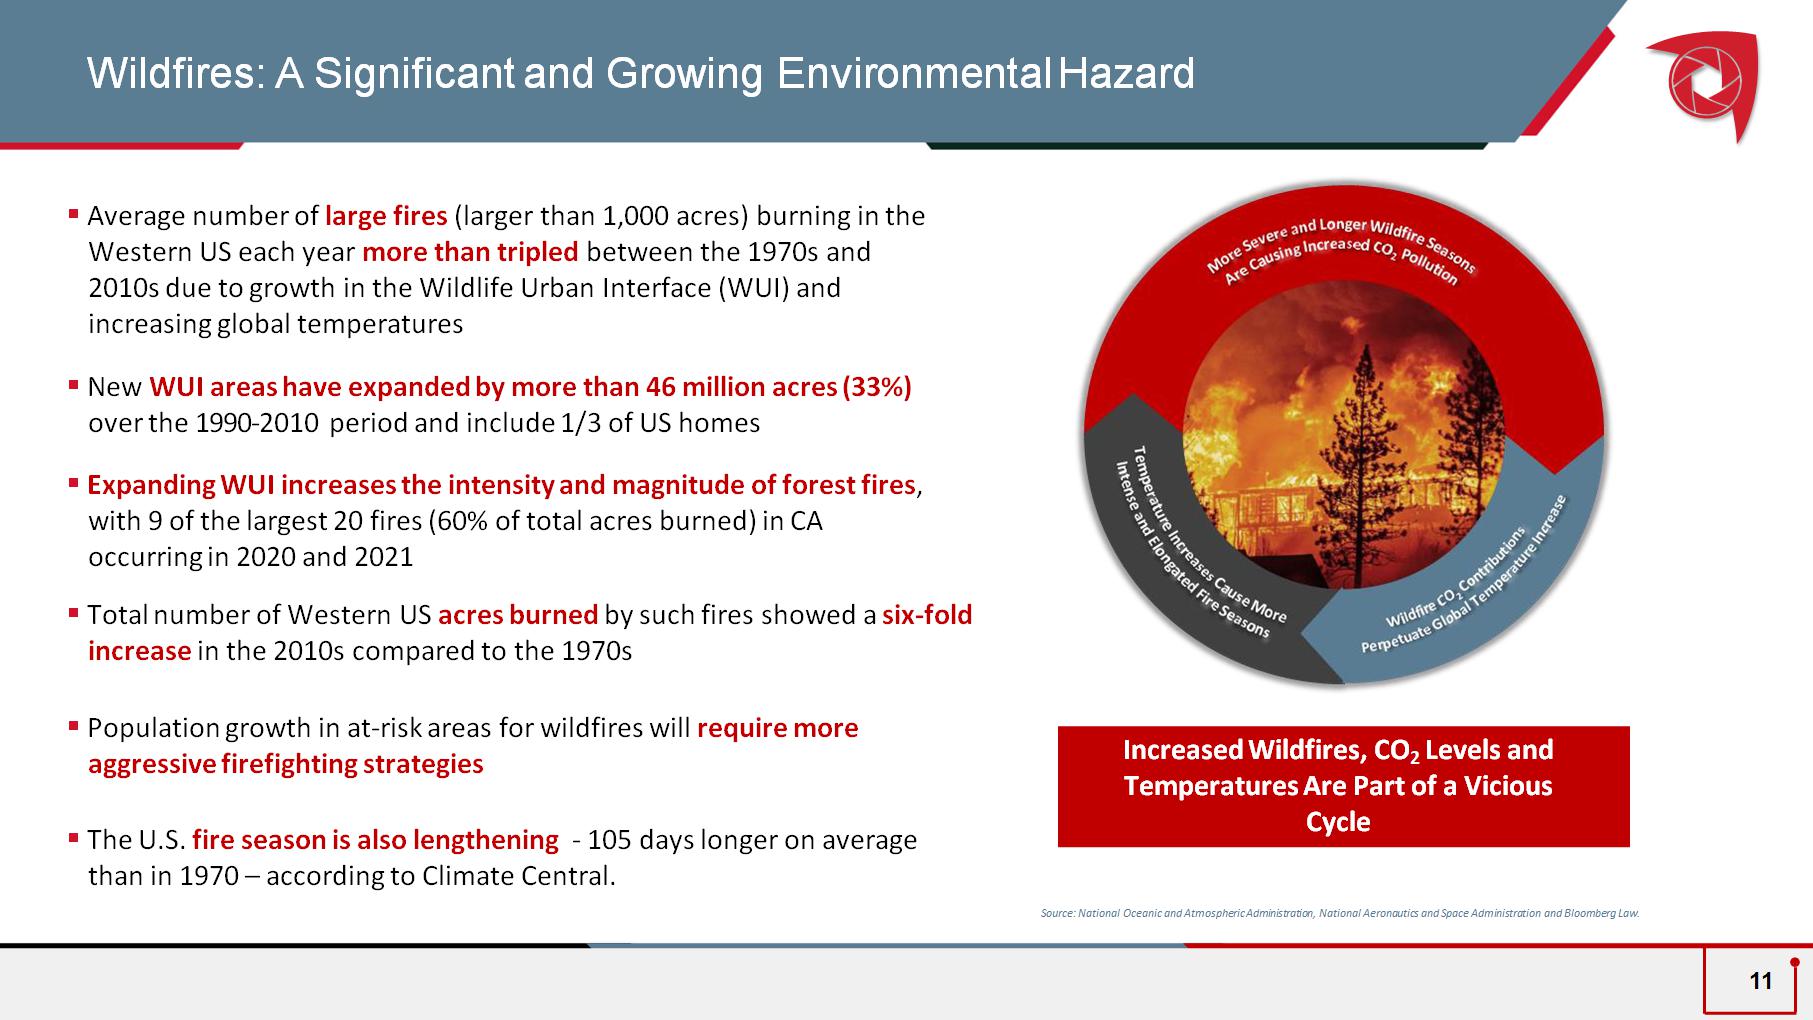
Wildfires: A Significant and Growing Environmental Hazard Increased Wildfires, CO 2 Levels and Temperatures Are Part of a Vicious Cycle 11 ▪ Average number of large fires (larger than 1,000 acres) burning in the Western US each year more than tripled between the 1970s and 2010s due to growth in the Wildlife Urban Interface (WUI) and increasing global temperatures ▪ New WUI areas have expanded by more than 46 million acres (33%) over the 1990 - 2010 period and include 1/3 of US homes ▪ Expanding WUI increases the intensity and magnitude of forest fires , with 9 of the largest 20 fires (60% of total acres burned) in CA occurring in 2020 and 2021 ▪ Total number of Western US acres burned by such fires showed a six - fold increase in the 2010s compared to the 1970s ▪ Population growth in at - risk areas for wildfires will require more aggressive firefighting strategies ▪ The U.S. fire season is also lengthening - 105 days longer on average than in 1970 – according to Climate Central. Source: National Oceanic and Atmospheric Administration, National Aeronautics and Space Administration and Bloomberg Law.
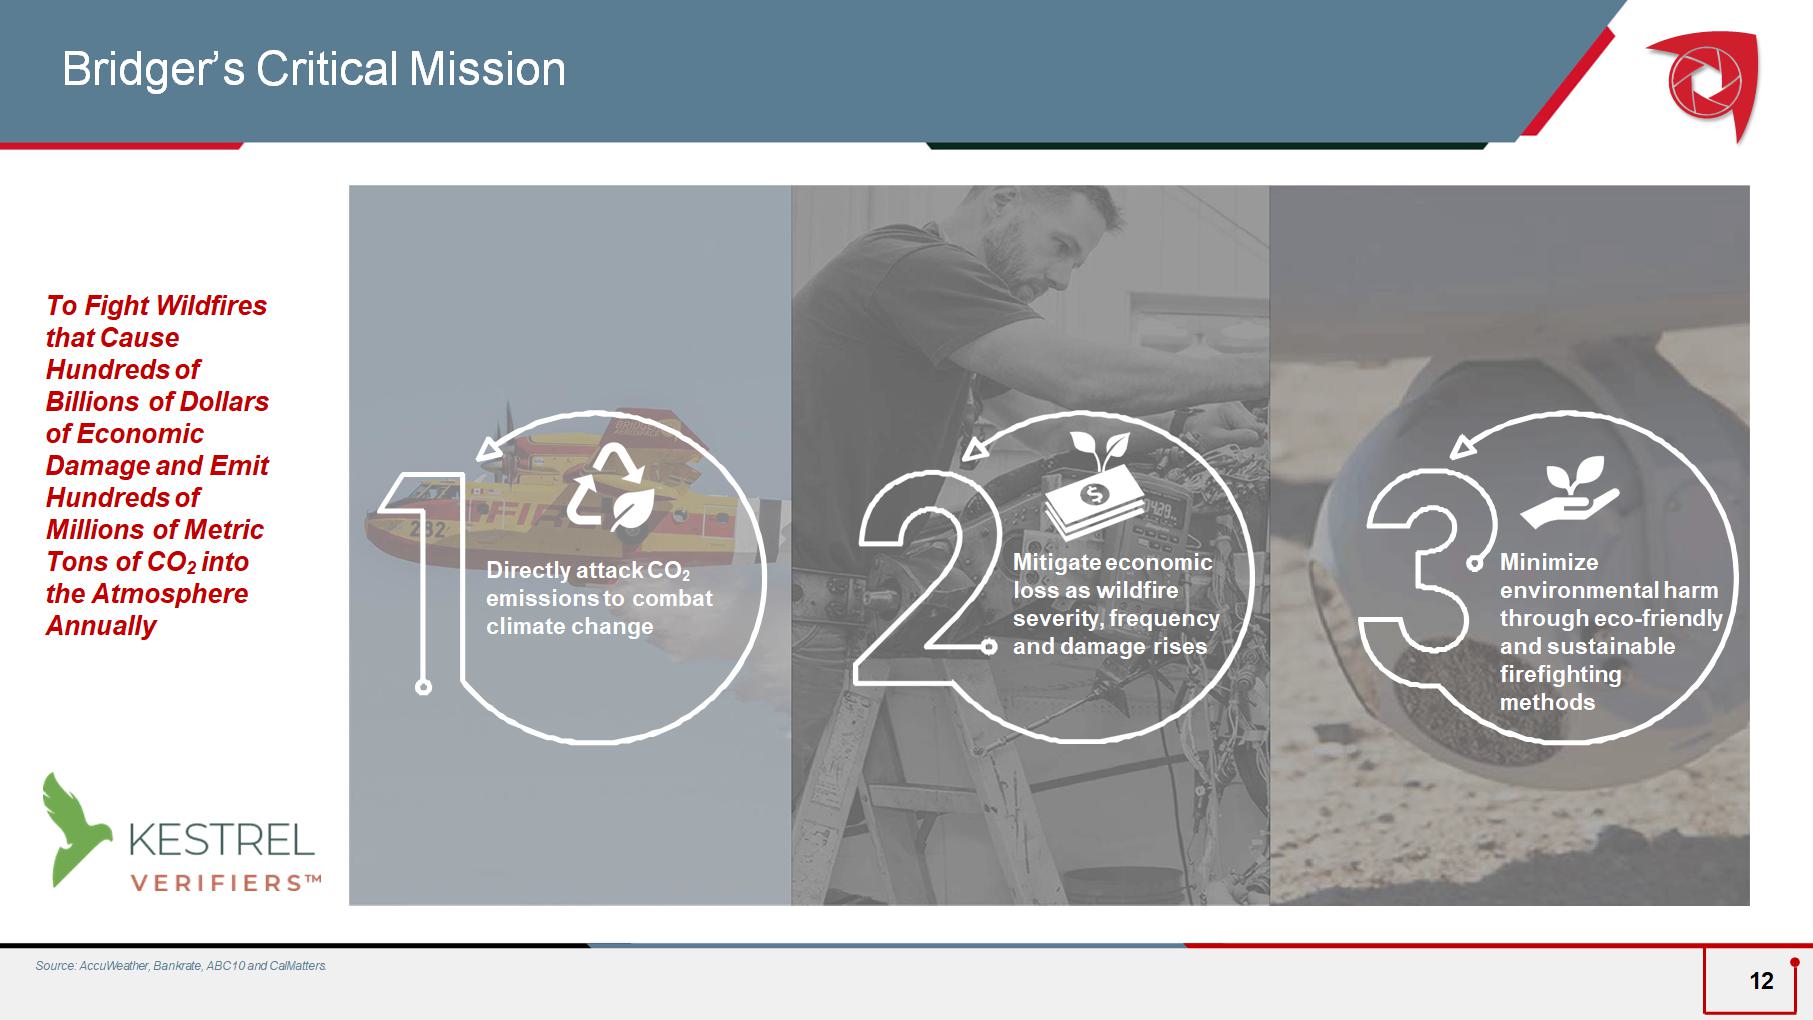
Directly attack CO 2 emissions to combat climate change Minimize environmental harm through eco - friendly and sustainable firefighting methods Mitigate economic loss as wildfire severity, frequency and damage rises To Fight Wildfires that Cause Hundreds of Billions of Dollars of Economic Damage and Emit Hundreds of Millions of Metric Tons of CO 2 into the Atmosphere Annually Bridger’s Critical Mission 12 Source: AccuWeather, Bankrate, ABC10 and CalMatters.
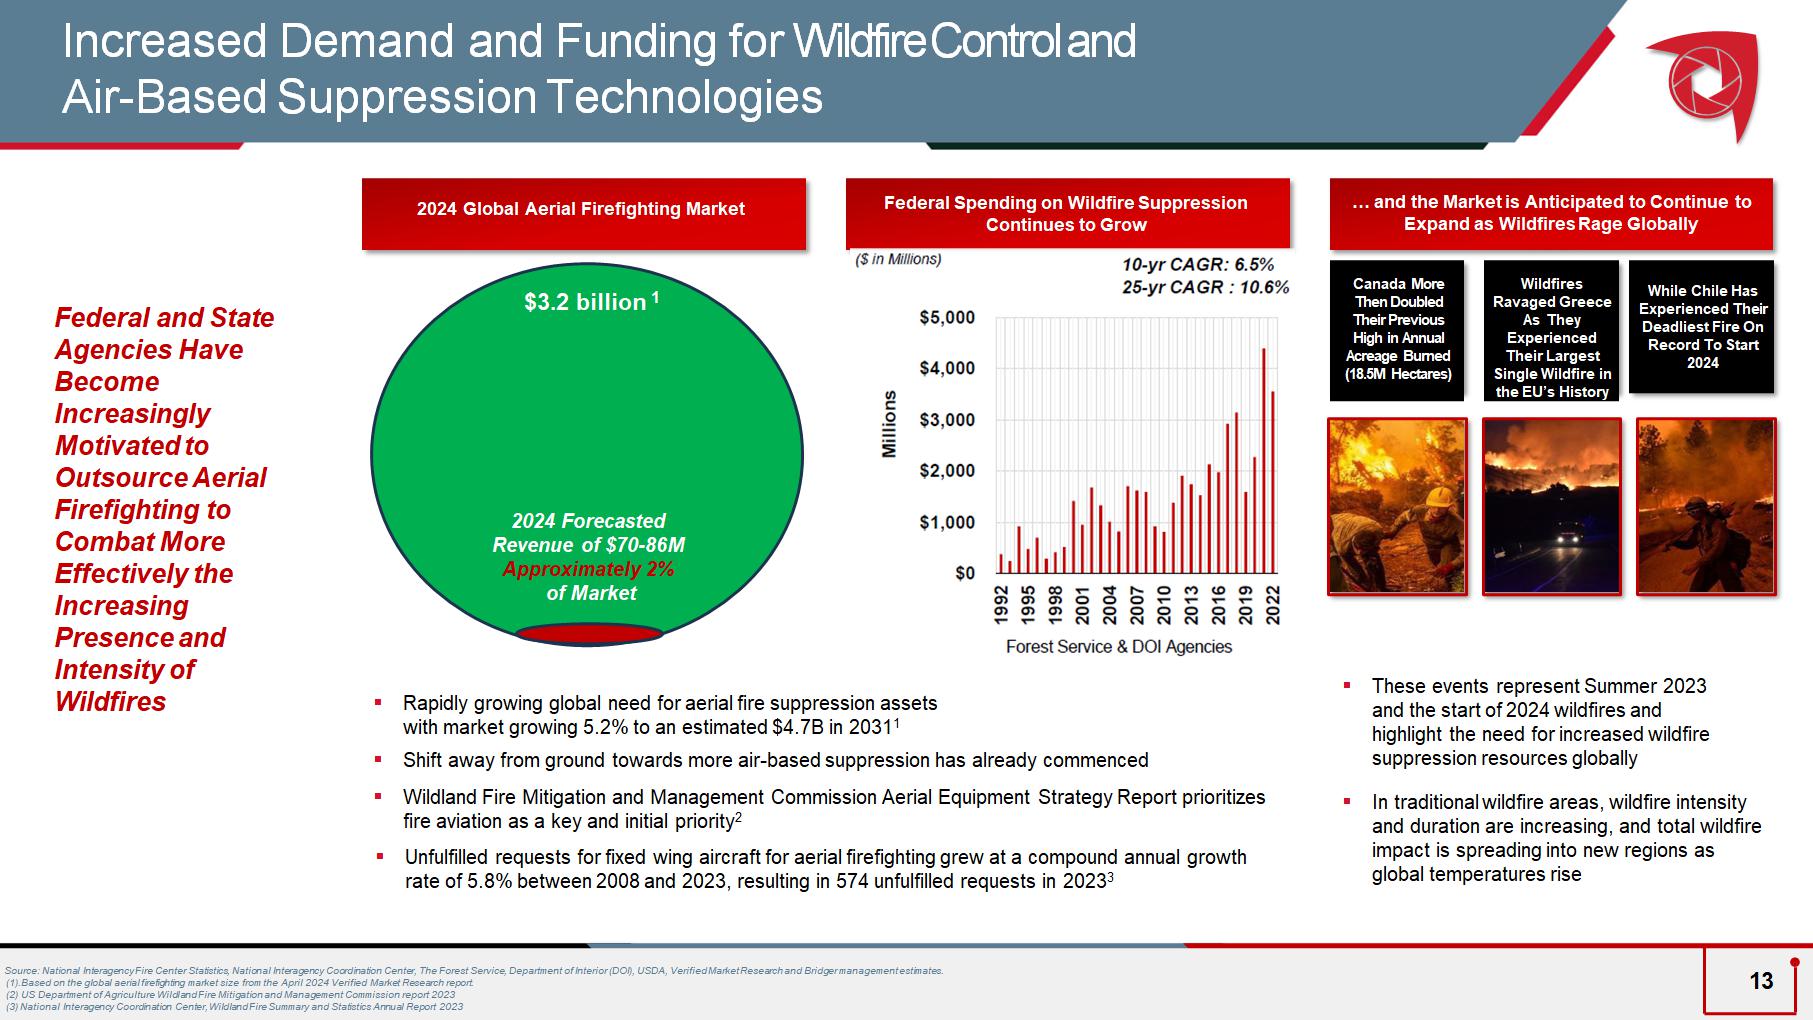
$5.8 bn $0.3 bn $3.1 bn $9.5 bn Source: National Interagency Fire Center Statistics, National Interagency Coordination Center, The Forest Service, Department of Interior (DOI), USDA, V erified Market Research and Bridger management estimates. (1). Based on the global aerial firefighting market size from the April 2024 Verified Market Research report . ( 2 ) US Department of Agriculture Wildland Fire Mitigation and Management Commission report 2023 (3) National Interagency Coordination Center, Wildland Fire Summary and Statistics Annual Report 2023 2024 Global Aerial Firefighting Market … and the Market is Anticipated to Continue to Expand as Wildfires Rage Globally ▪ Rapidly growing global need for aerial fire suppression assets with market growing 5.2% to an estimated $4.7B in 2031 1 ▪ Shift away from ground towards more air - based suppression has already commenced ▪ Wildland Fire Mitigation and Management Commission Aerial Equipment Strategy Report prioritizes fire aviation as a key and initial priority 2 ▪ Unfulfilled requests for fixed wing aircraft for aerial firefighting grew at a compound annual growth rate of 5.8% between 2008 and 2023, resulting in 574 unfulfilled requests in 2023 3 Federal and State Agencies Have Become Increasingly Motivated to Outsource Aerial Firefighting to Combat More Effectively the Increasing Presence and Intensity of Wildfires Increased Demand and Funding for Wildfire Control and Ai r - Based Suppression Technologies ▪ These events represent Summer 202 3 and the start of 2024 wildfires and highlight the need for increased wildfire suppression resources globally ▪ In traditional wildfire areas, wildfire intensity and duration are increasing, and total wildfire impact is spreading into new regions as global temperatures rise Canada More Then Doubled Their Previous High in Annual Acreage Burned (18.5M Hectares) While Chile Has Experienced Their Deadliest Fire On Record To Start 2024 Wildfires Ravaged Greece As They Experienced Their Largest Single Wildfire in the EU’s History Federal Spending on Wildfire Suppression Continues to Grow Forest Service & DOI Agencies 10 - yr CAGR: 6.5% 25 - yr CAGR : 10.6% ($ in Millions) $0 $1,000 $2,000 $3,000 $4,000 $5,000 1992 1995 1998 2001 2004 2007 2010 2013 2016 2019 2022 Millions Update $3.2 billion 1 2024 Forecasted Revenue of $70 - 86M Approximately 2% of Market 13
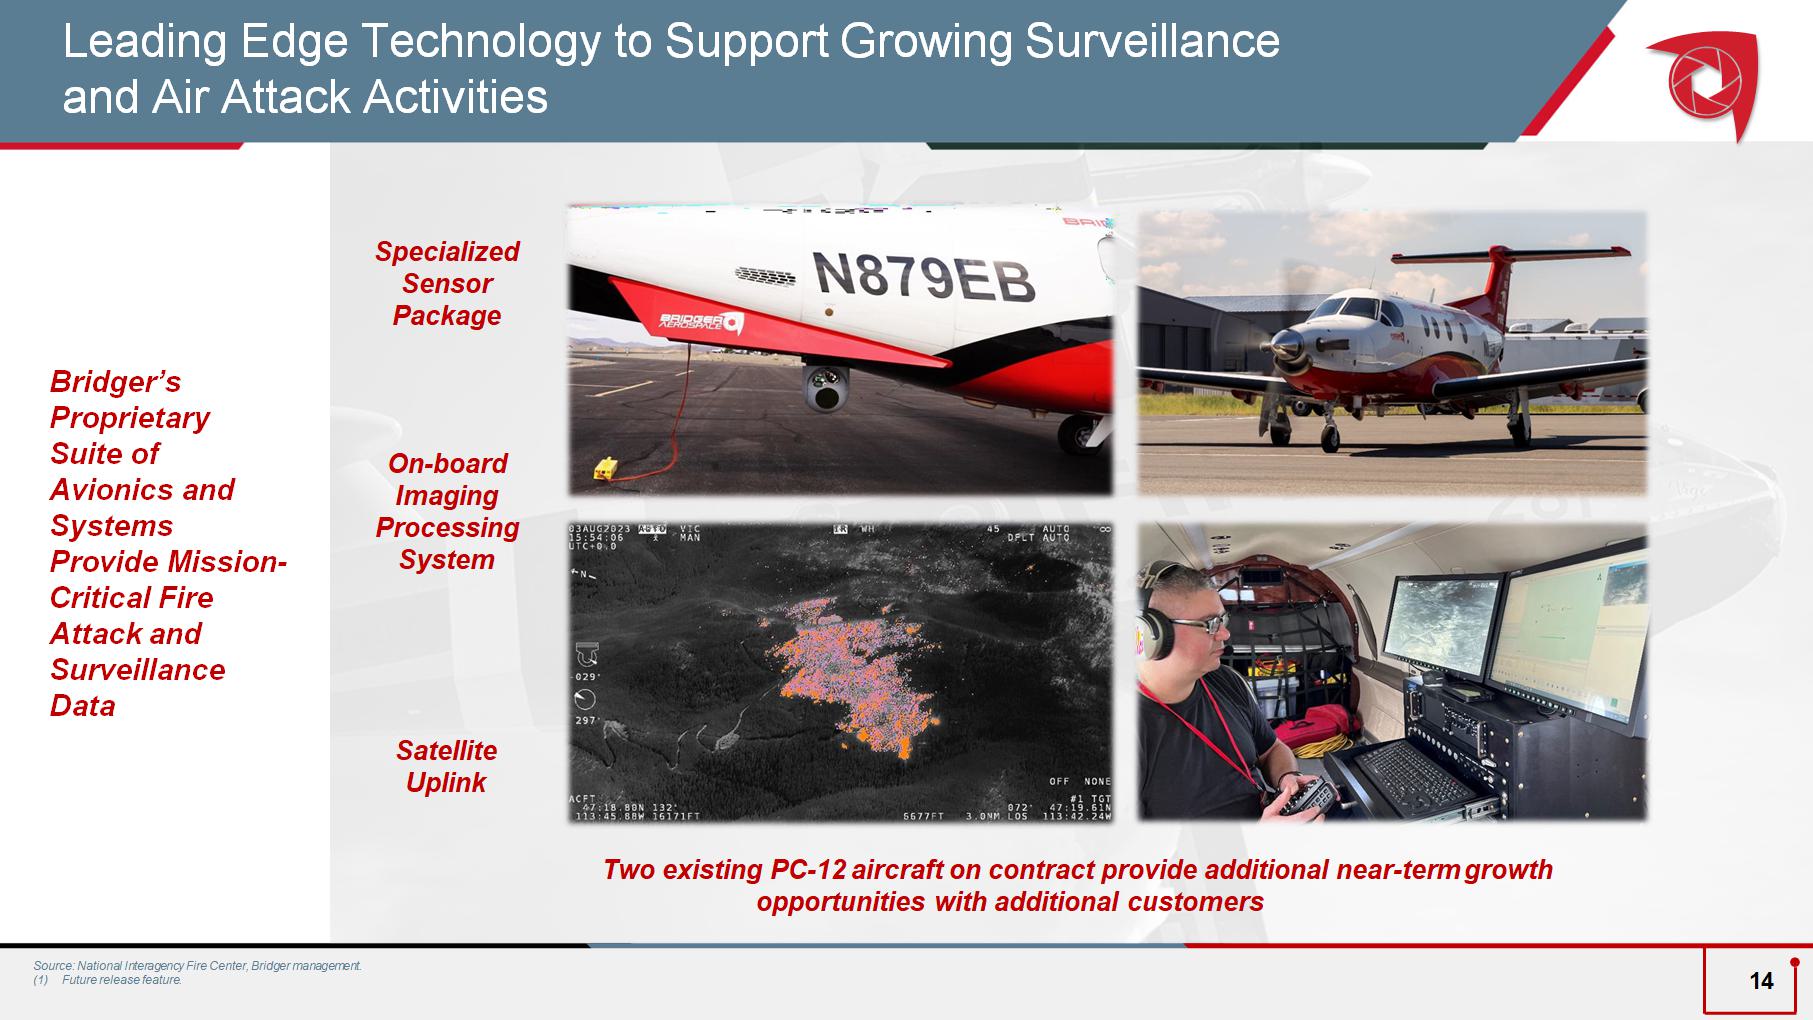
Bridger’s Proprietary Suite of Avionics and Systems Provide Mission - Critical Fire Attack and Surveillance Data Leading Edge Technology to Support Growing Surveillance and Air Attack Activities Source: National Interagency Fire Center, Bridger management. Specialized Sensor Package On - board Imaging Processing System Satellite Uplink Two existing PC - 12 aircraft on contract provid e additional near - term growth opportunities with additional customers (1) Future release feature. 14
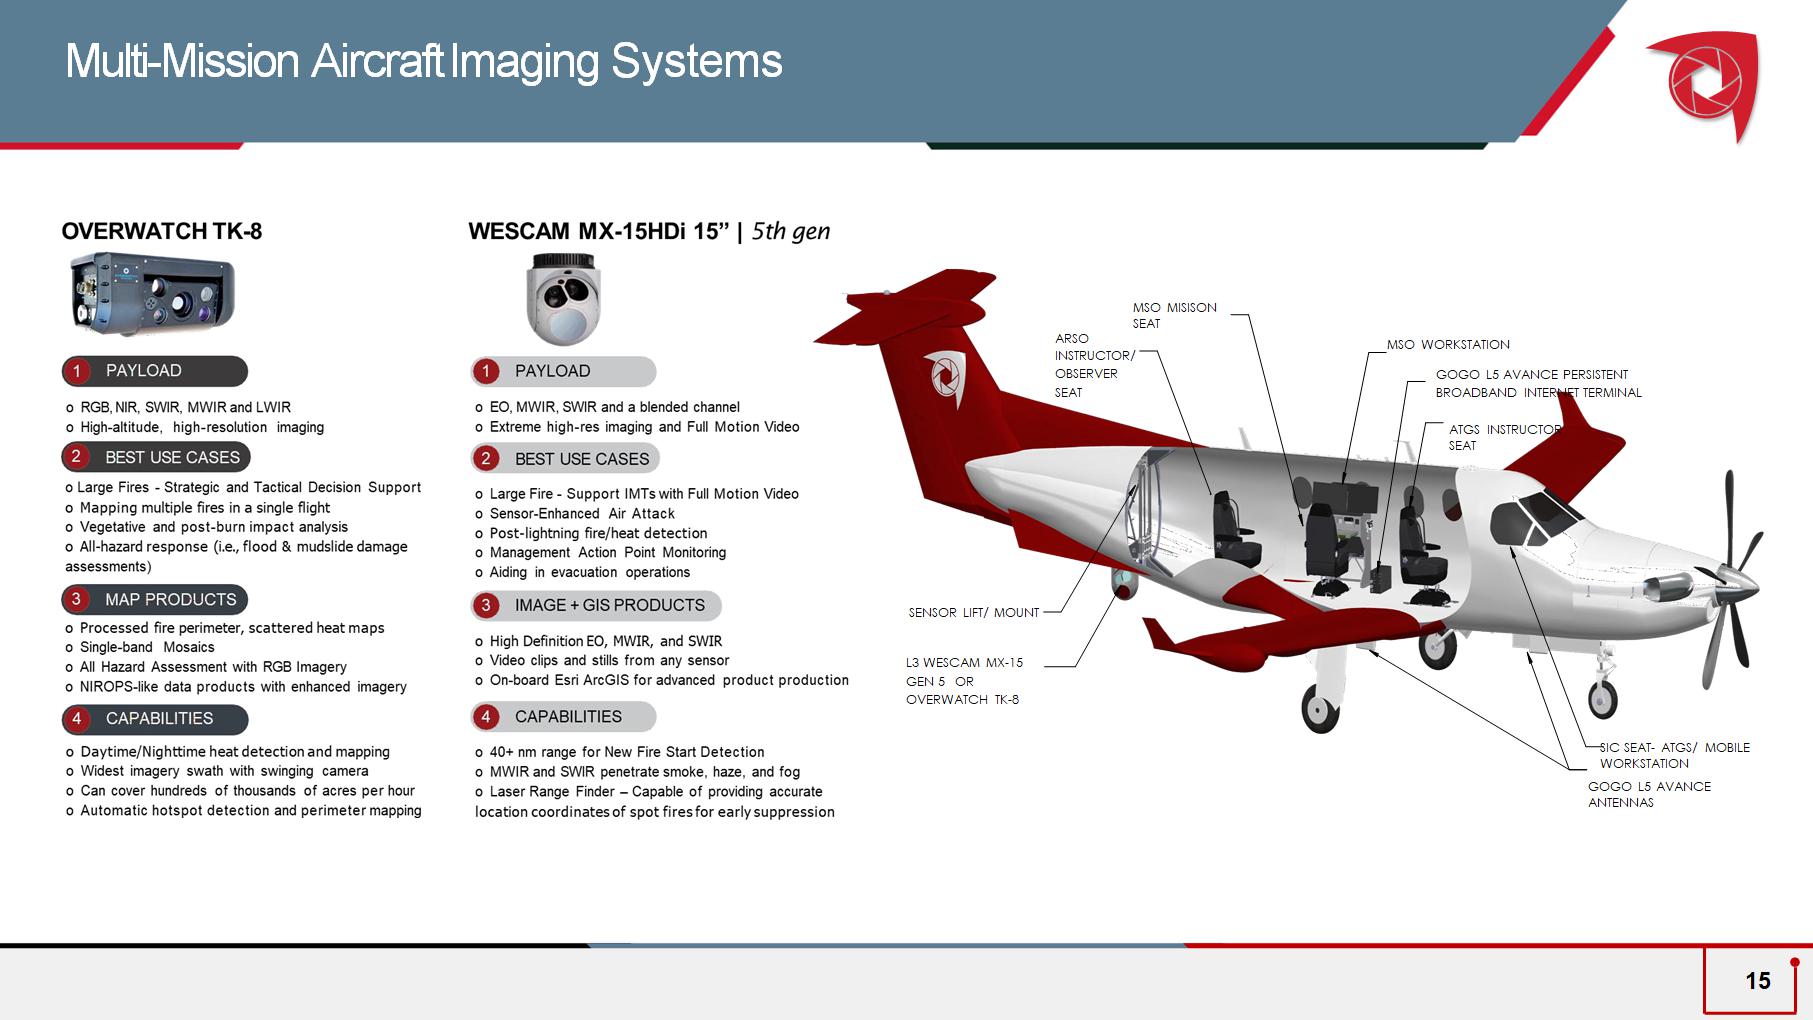
Multi - Mission Aircraft Imaging Systems SENSOR LIFT/ MOUNT L3 WESCAM MX - 15 GEN 5 OR OVERWATCH TK - 8 ARSO INSTRUCTOR/ OBSERVER SEAT MSO WORKSTATION MSO MISISON SEAT GOGO L5 AVANCE PERSISTENT BROADBAND INTERNET TERMINAL ATGS INSTRUCTOR SEAT SIC SEAT - ATGS/ MOBILE WORKSTATION GOGO L5 AVANCE ANTENNAS 15
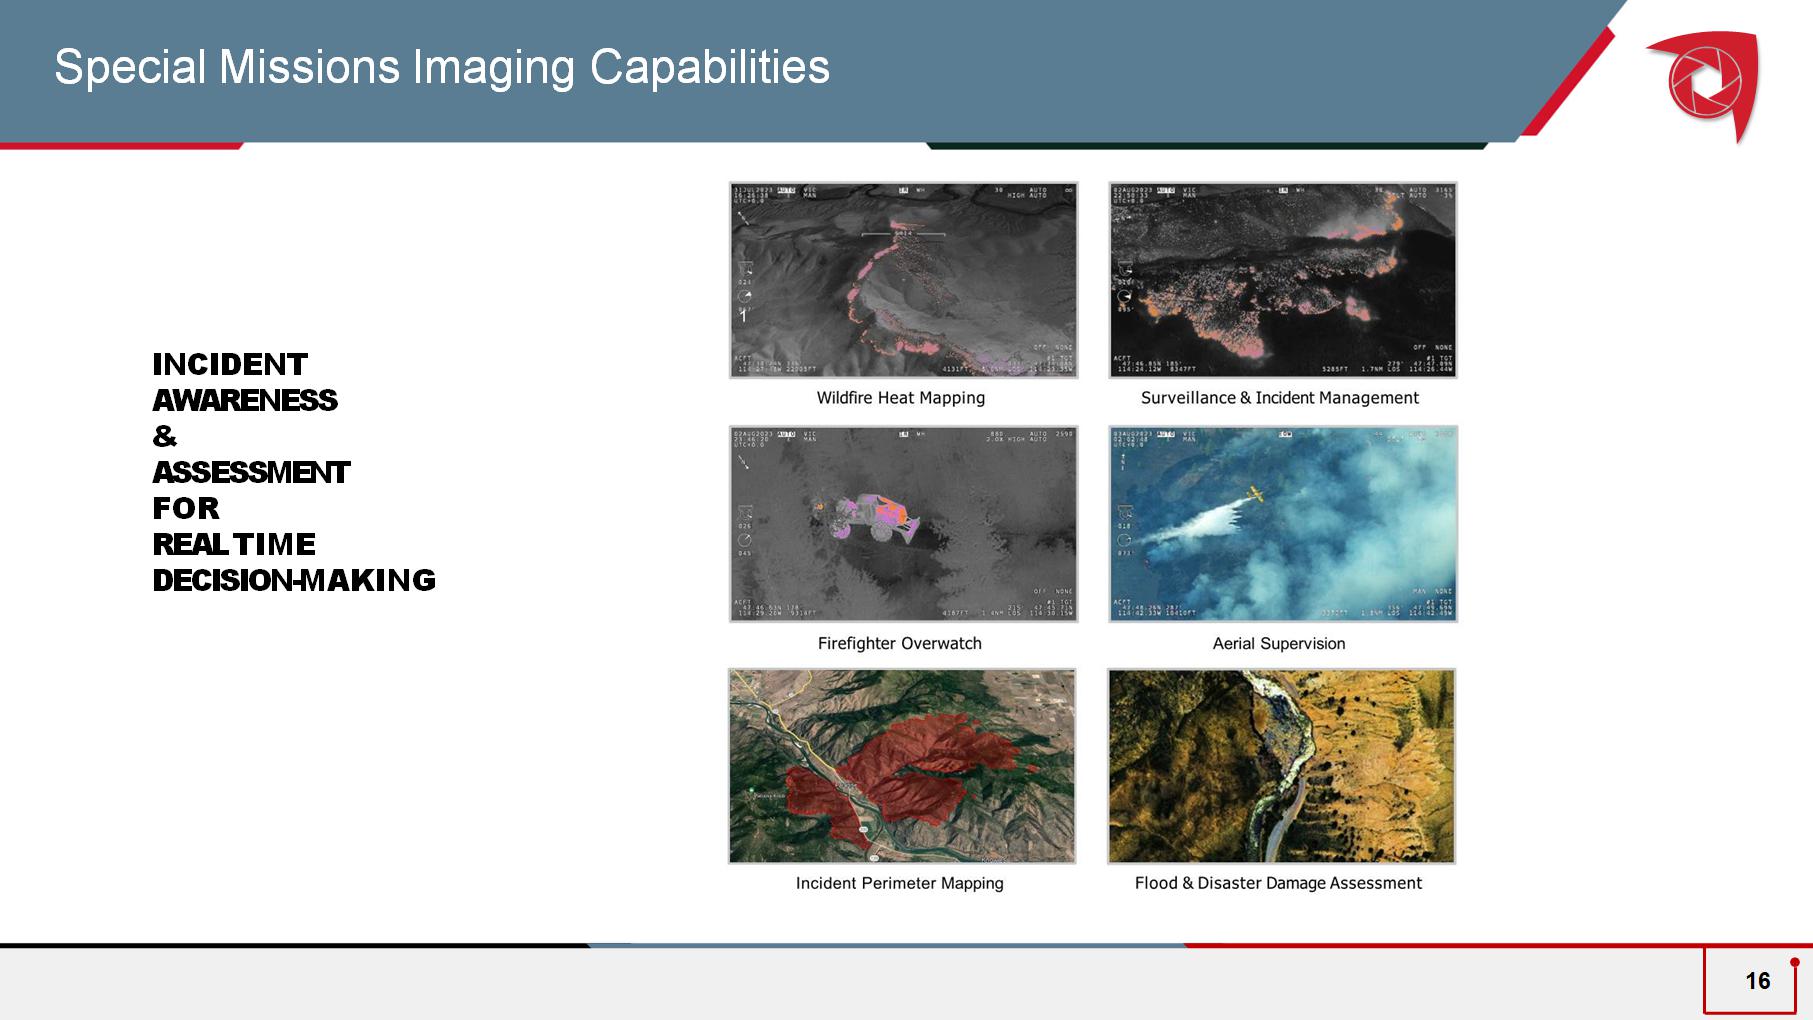
Special Missions Imaging Capabilities INCIDENT AWARENESS & ASSESSMENT FOR REAL TIME DECISION - MAKING 16
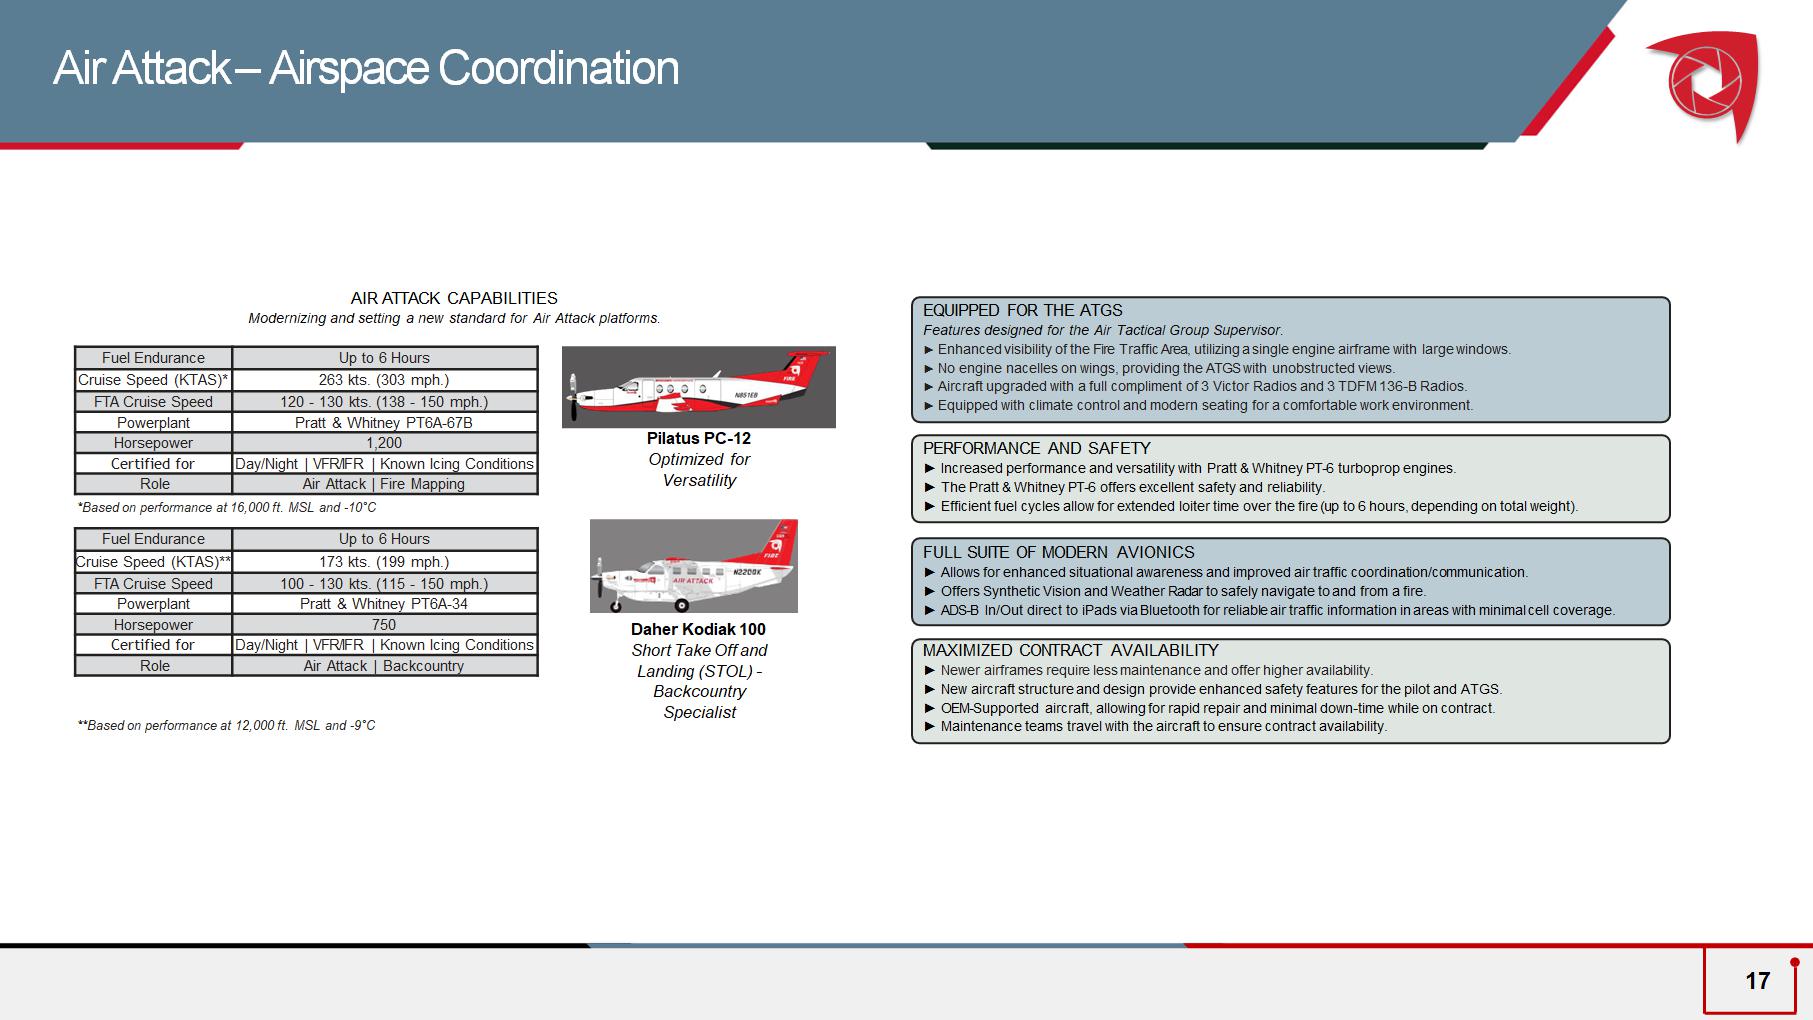
AIR ATTACK CAPABILITIES Modernizing and setting a new standard for Air Attack platforms. Pilatus PC - 12 Optimized for Versatility Daher Kodiak 100 S hort Take Off and Landing (S TOL ) - Backcountry Specialist ** Based on performance at 12,000 ft. MSL and - 9 ƒ C 17 EQUIPPED FOR THE ATGS Features designed for the Air Tactical Group Supervisor. ► Enhanced visibility of the Fire Traffic Area, utilizing a single engine airframe with large windows. ► No engine nacelles on wings, providing the ATGS with unobstructed views. ► Aircraft upgraded with a full compliment of 3 Victor Radios and 3 TDFM 136 - B Radios. ► Equipped with climate control and modern seating for a comfortable work environment. PERFORMANCE AND SAFETY ► Increased performance and versatility with Pratt & Whitney PT - 6 turboprop engines. ► The Pratt & Whitney PT - 6 offers excellent safety and reliability. ► Efficient fuel cycles allow for extended loiter time over the fire (up to 6 hours, depending on total weight). FULL SUITE OF MODERN AVIONICS ► Allows for enhanced situational awareness and improved air traffic coordination/communication. ► Offers Synthetic Vision and Weather Radar to safely navigate to and from a fire. ► ADS - B In/Out direct to iPads via Bluetooth for reliable air traffic information in areas with minimal cell coverage. MAXIMIZED CONTRACT AVAILABILITY ► Newer airframes require less maintenance and offer higher availability. ► New aircraft structure and design provide enhanced safety features for the pilot and ATGS. ► OEM - Supported aircraft, allowing for rapid repair and minimal down - time while on contract. ► Maintenance teams travel with the aircraft to ensure contract availability. Up to 6 Hours Fuel Endurance 263 kts. (303 mph.) Cruise Speed (KTAS)* 120 - 130 kts. (138 - 150 mph.) FTA Cruise Speed Pratt & Whitney PT6A - 67B Powerplant 1,200 Horsepower Day/Night | VFR/IFR | Known Icing Conditions Certified for Air Attack | Fire Mapping Role Up to 6 Hours Fuel Endurance 173 kts. (199 mph.) Cruise Speed (KTAS)** 100 - 130 kts. (115 - 150 mph.) FTA Cruise Speed Pratt & Whitney PT6A - 34 Powerplant 750 Horsepower Day/Night | VFR/IFR | Known Icing Conditions Certified for Air Attack | Backcountry Role * Based on performance at 16,000 ft. MSL and - 10 ƒ C Air Attack – Airspace Coordination
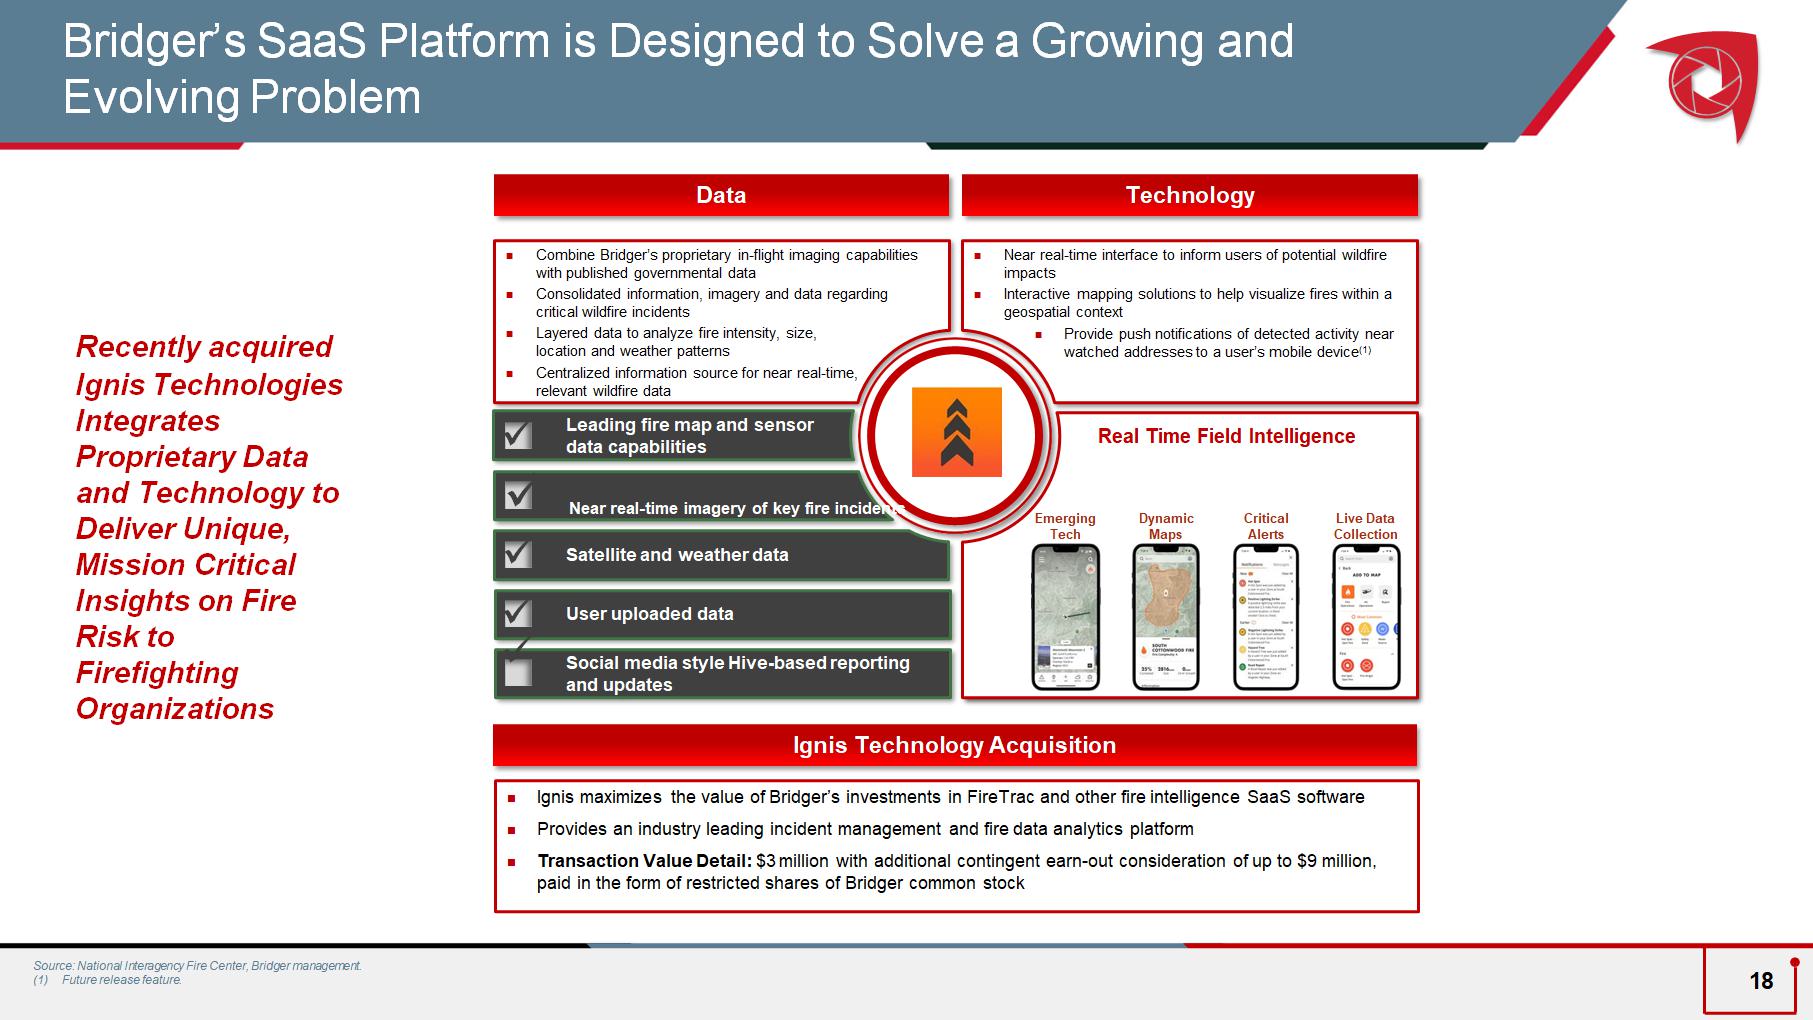
Recently acquired Ignis Technologies Integrates Proprietary Data and Technology to Deliver Unique, Mission Critical Insights on Fire Risk to Firefighting Organizations Bridger’s SaaS Platform is Designed to Solve a Growing and Evolving Problem Combine Bridger’s proprietary in - flight imaging capabilities with published governmental data Consolidated information, imagery and data regarding critical wildfire incidents Layered data to analyze fire intensity, size, location and weather patterns Centralized information source for near real - time, relevant wildfire data Near real - time interface to inform users of potential wildfire impacts Interactive mapping solutions to help visualize fires within a geospatial context ; Provide push notifications of detected activity near watched addresses to a user’s mobile device (1) Leading fire map and sensor data capabilities Satellite and weather data User uploaded data Data Technology x x x Near real - time imagery of key fire incidents x x x Social media style Hive - based reporting and updates Ignis maximizes the value of Bridger’s investments in FireTrac and other fire intelligence SaaS software Provides an industry leading incident management and fire data analytics platform Transaction Value Detail: $3 million with additional contingent earn - out consideration of up to $9 million, paid in the form of restricted shares of Bridger common stock Ignis Technology Acquisition Real Time Field Intelligence Live Data Collection Dynamic Maps Critical Alerts Emerging Tech Source: National Interagency Fire Center, Bridger management. (1) Future release feature. 18
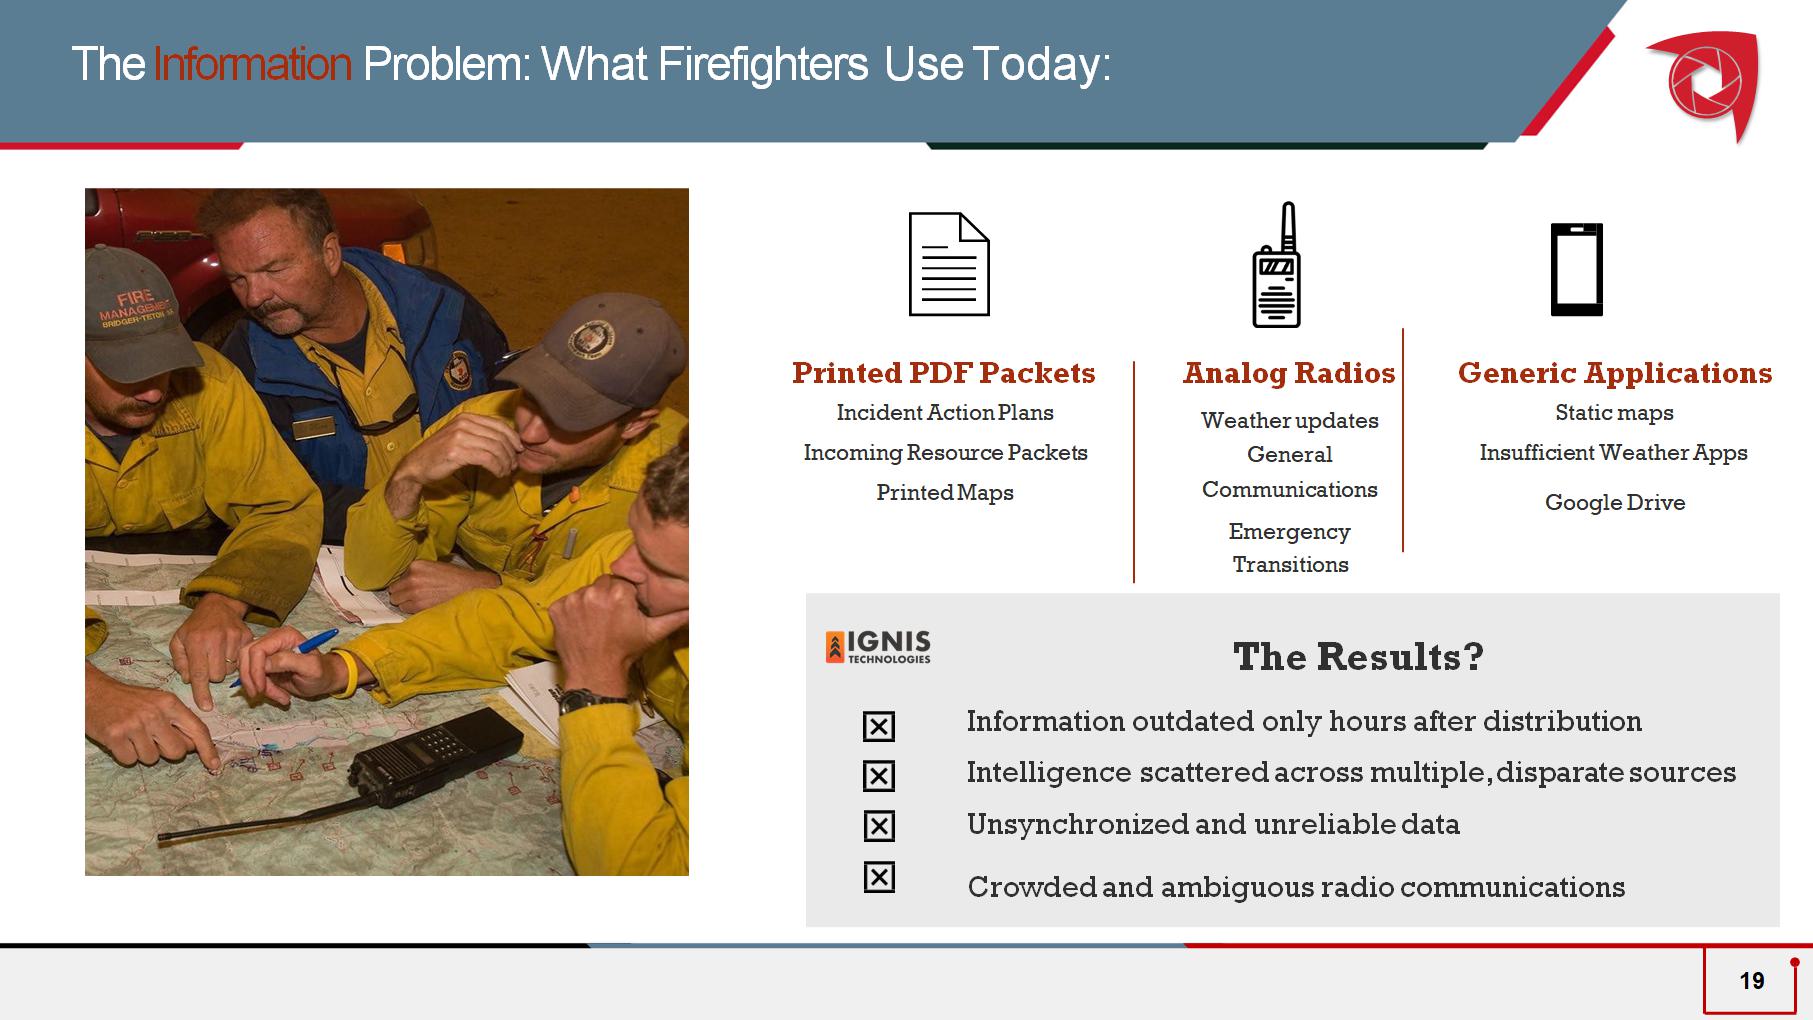
Printed PDF Packets Incident Action Plans Incoming Resource Packets Printed Maps Analog Radios Weather updates General Communications Emergency Transitions Generic Applications Static maps Insufficient Weather Apps Google Drive The Information Problem: What Firefighters Use Today: The Results? Information outdated only hours after distribution Intelligence scattered across multiple, disparate sources Unsynchronized and unreliable data Crowded and ambiguous radio communications 19
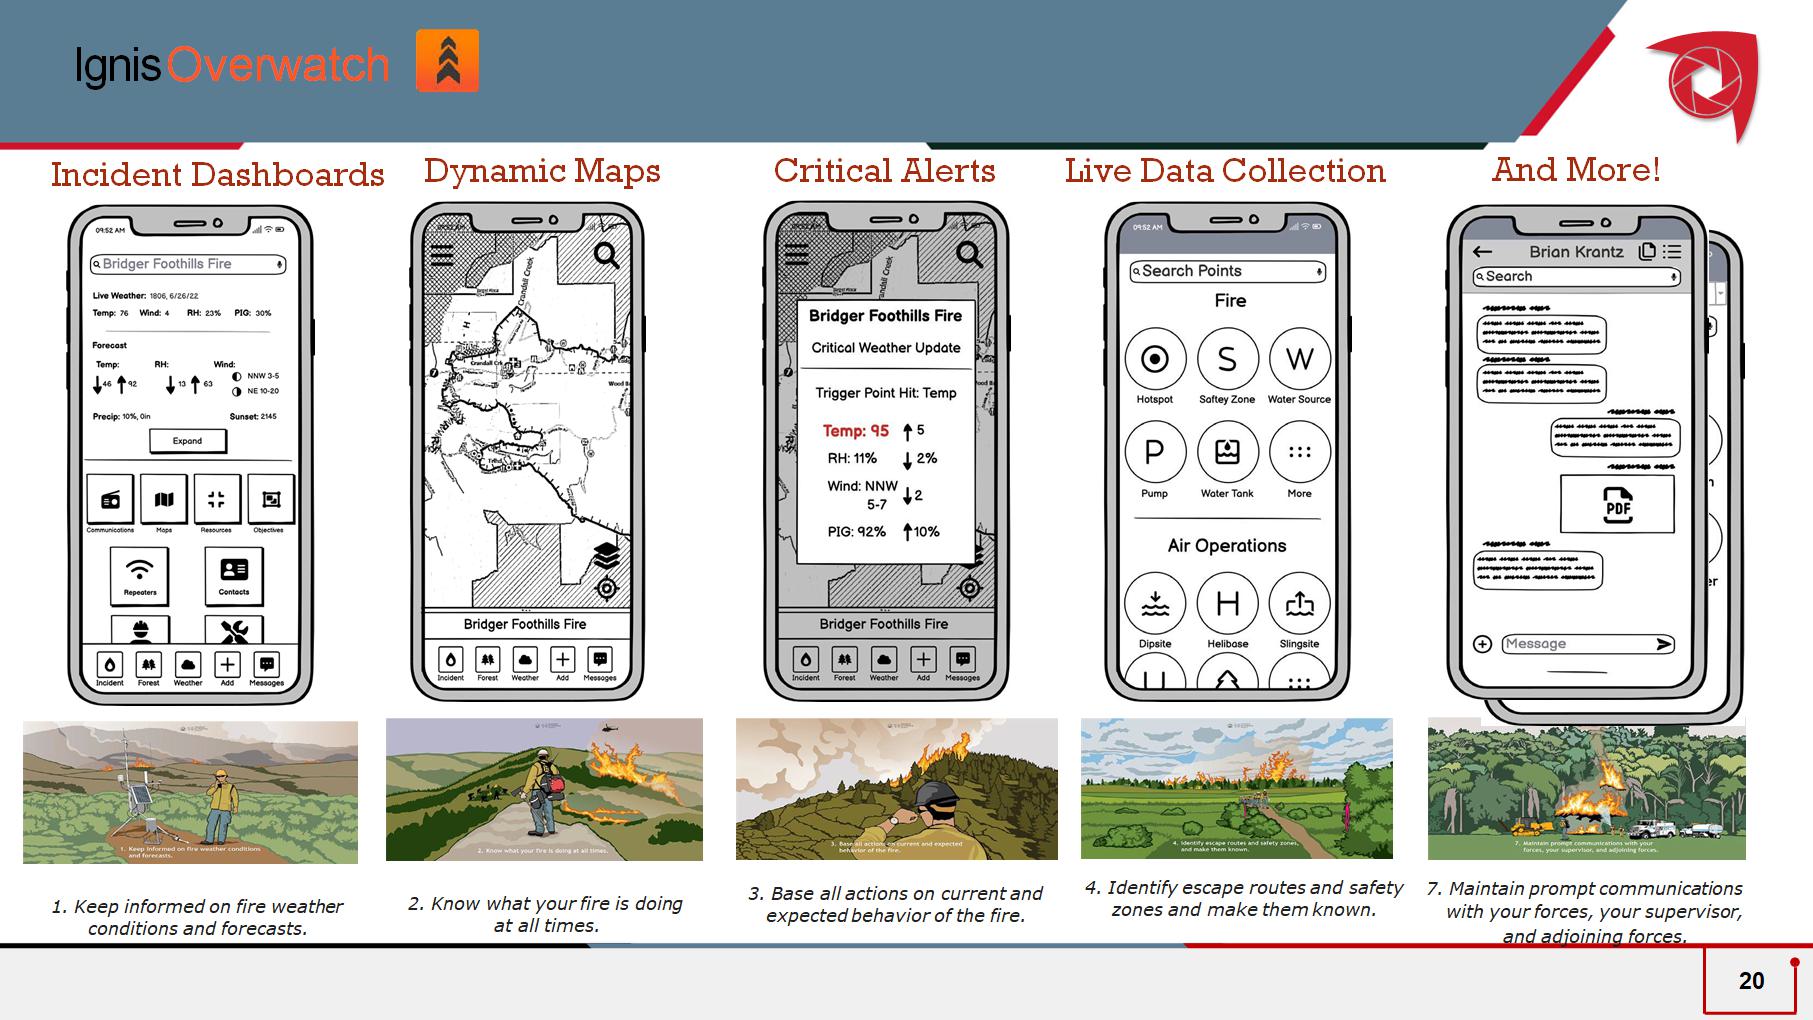
Dynamic Maps Critical Alerts Live Data Collection 1. Keep informed on fire weather conditions and forecasts. 2. Know what your fire is doing at all times. 3. Base all actions on current and expected behavior of the fire. 4. Identify escape routes and safety zones and make them known. 7. Maintain prompt communications with your forces, your supervisor, and adjoining forces. Incident Dashboards And More! Ignis Overwatch 20
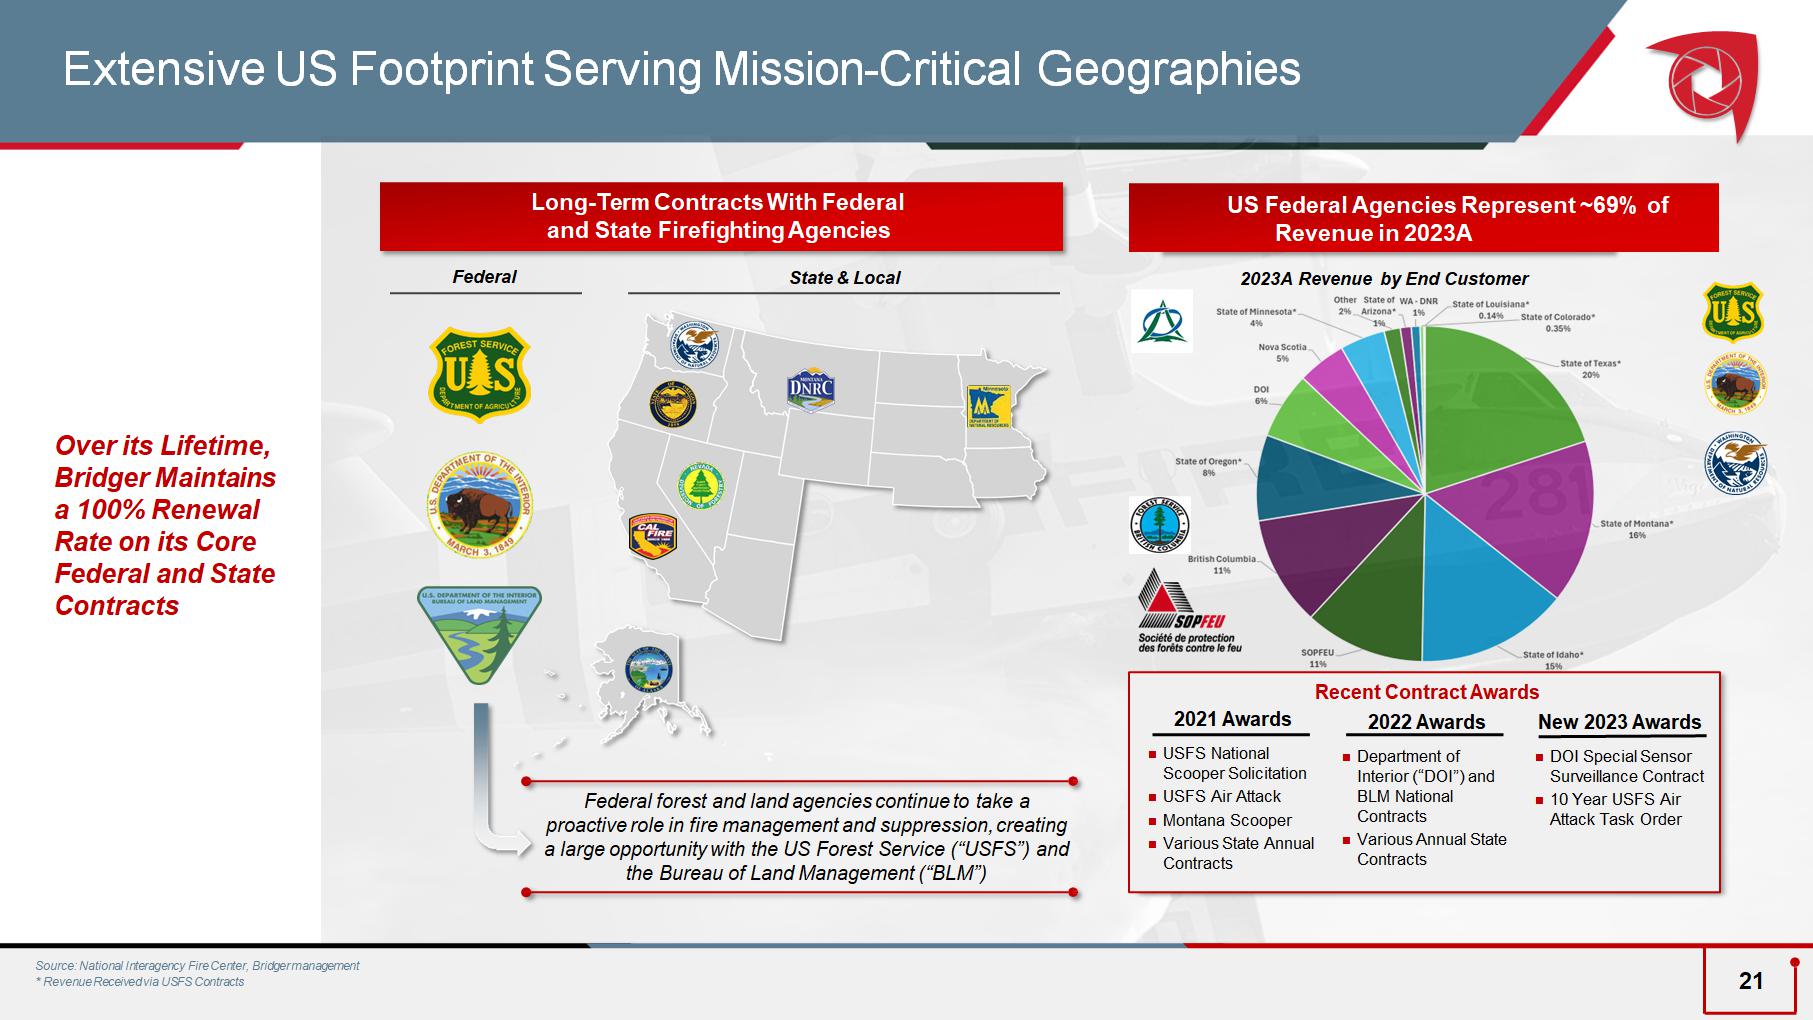
Long - Term Contracts With Federal and State Firefighting Agencies Federal State & Local Federal forest and land agencies continue to take a proactive role in fire management and suppression, creating a large opportunity with the US Forest Service (“USFS”) and the Bureau of Land Management (“BLM”) Over its Lifetime, Bridger Maintains a 100% Renewal Rate on its Core Federal and State Contracts Source: National Interagency Fire Center, Bridger managemen t * Revenue Received via USFS Contracts Extensive US Footprint Serving Mission - Critical Geogra phies US Federal Agencies Represent ~69% of Revenue in 2023A 202 3A Revenue by End Customer 2021 Awards USFS National Scooper Solicitation USFS Air Attack Montana Scooper Various State Annual Contracts 2022 Awards Department of Interior (“DOI”) and BLM National Contracts Various Annual State Contracts Recent Contract Awards New 2023 Awards DOI Special Sensor Surveillance Contract 10 Year USFS Air Attack Task Order 21
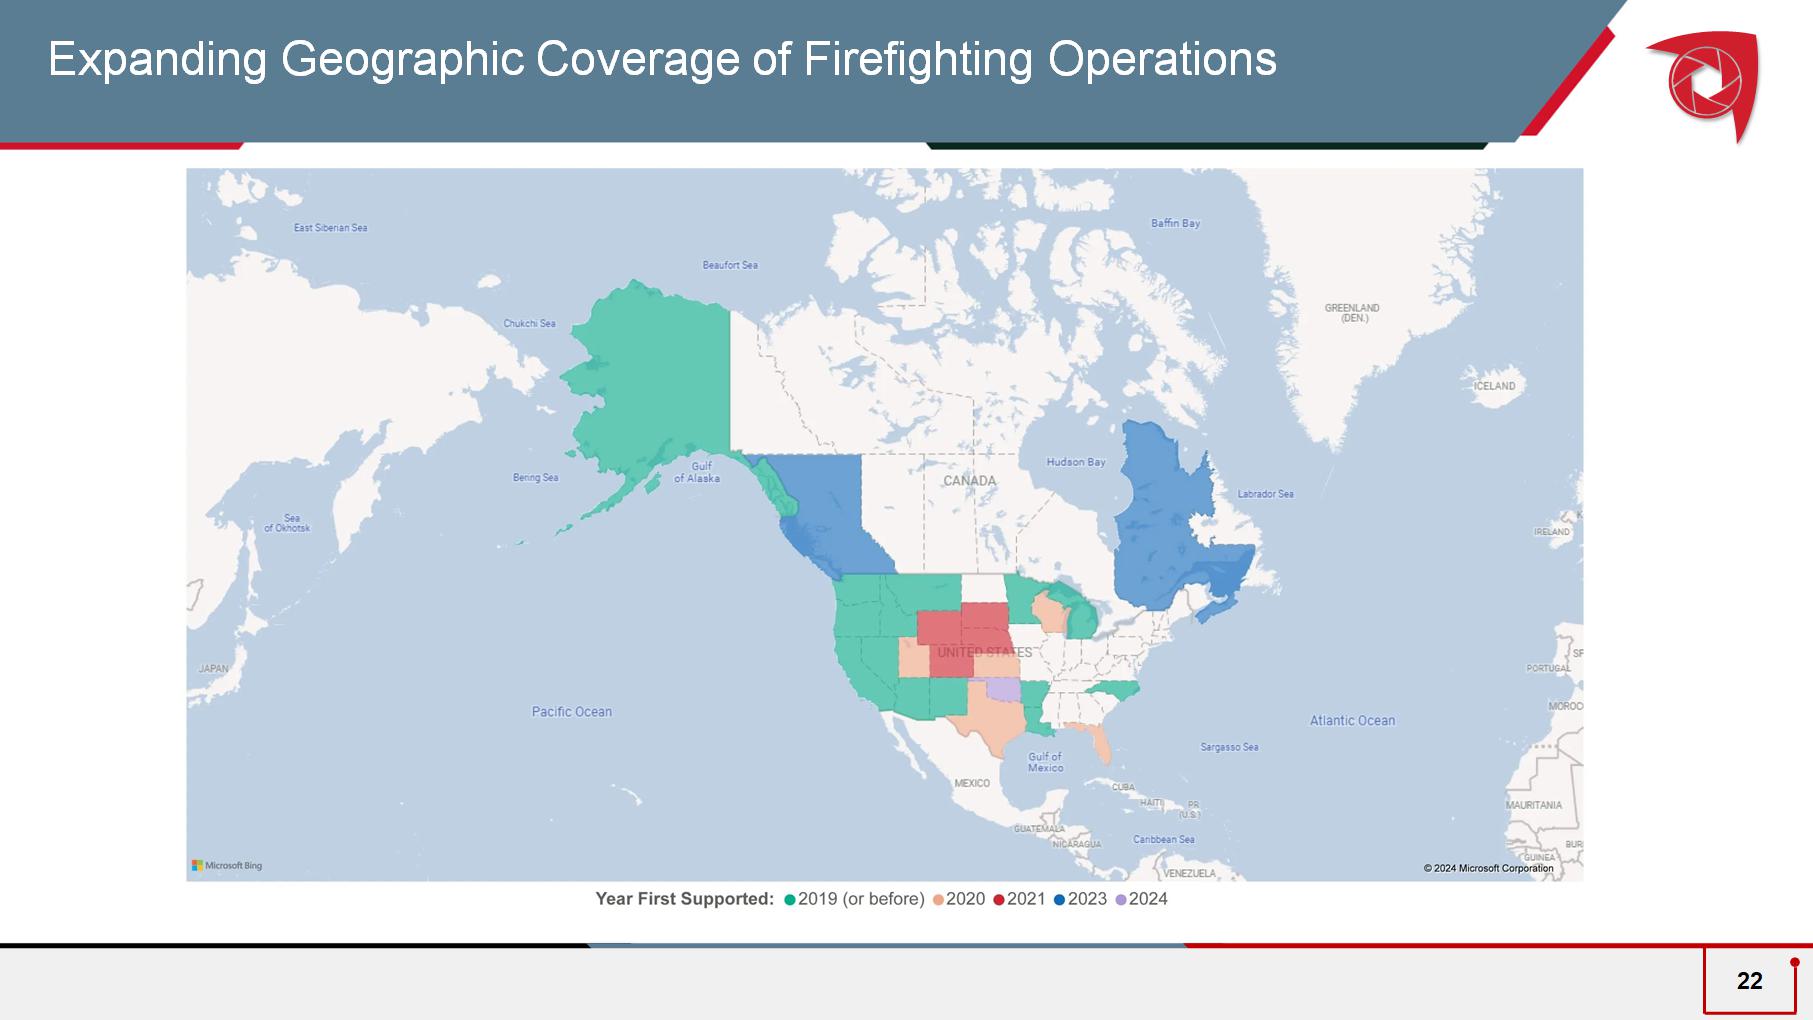
Expanding Geographic Coverage of Firefighting Operations 22
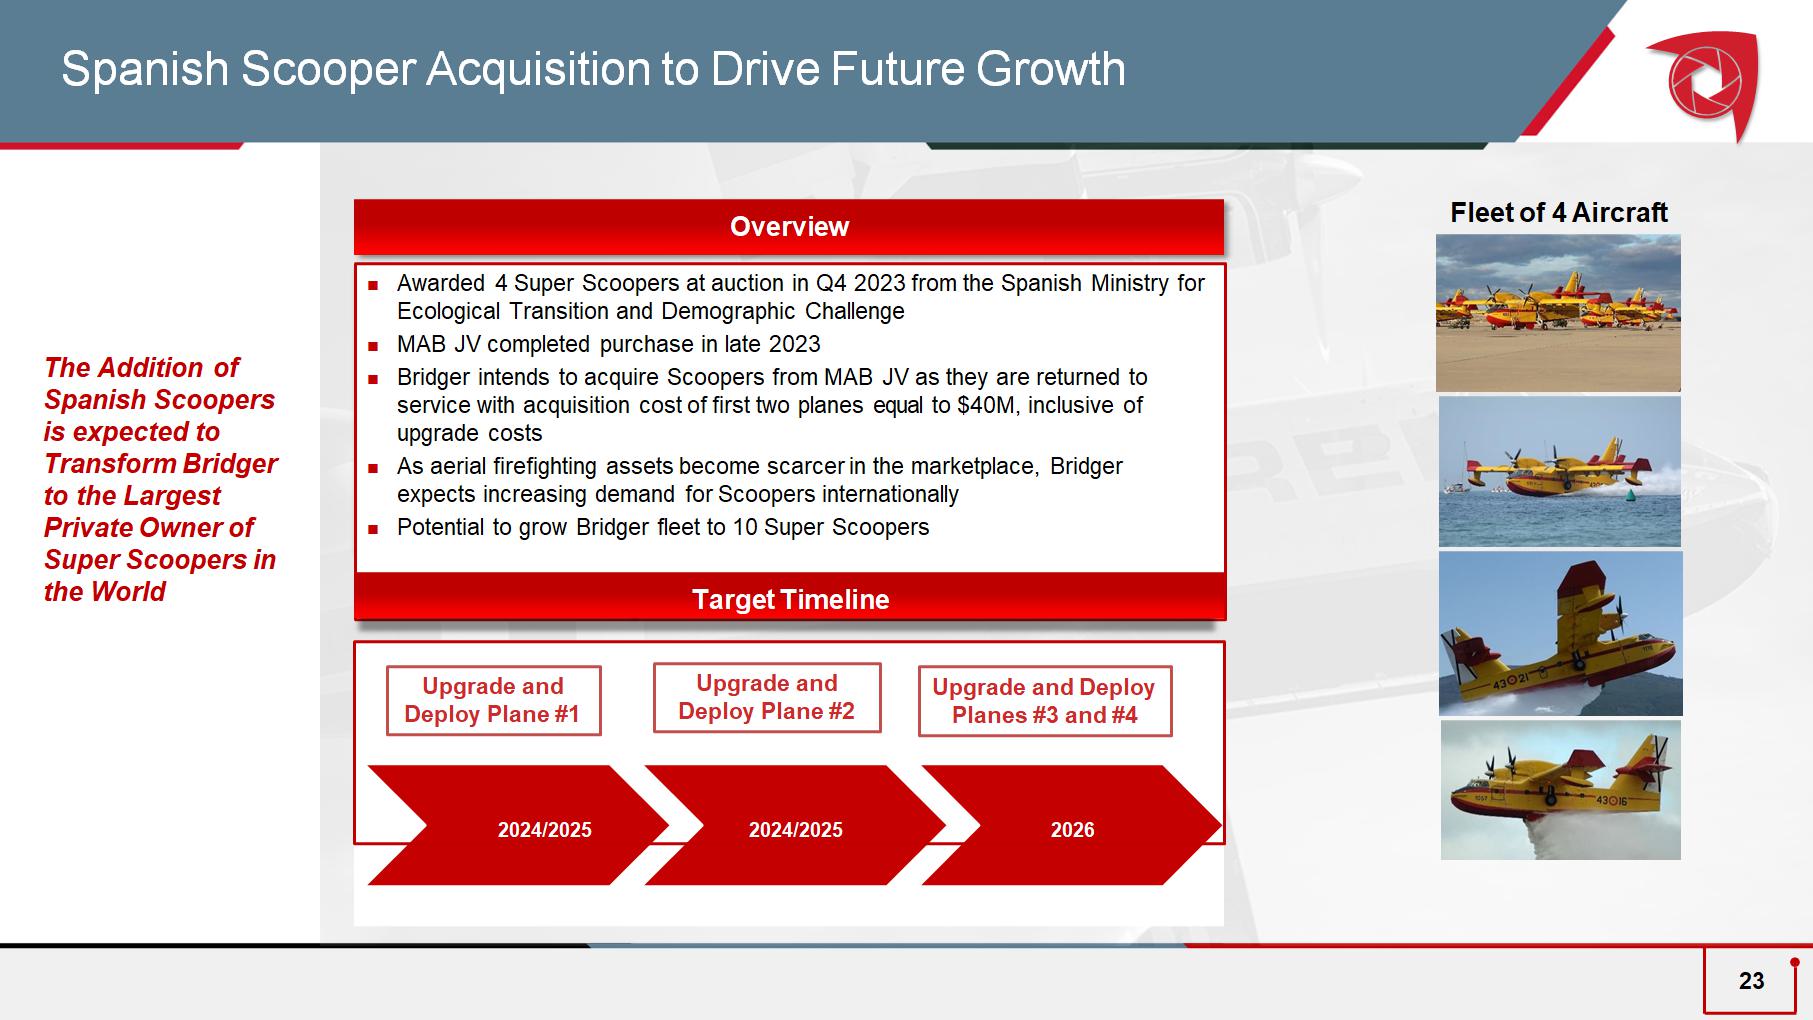
Awarded 4 Super Scoopers at auction in Q4 2023 from the Spanish Ministry for Ecological Transition and Demographic Challenge MAB JV completed purchase in late 2023 Bridger intends to acquire Scoopers from MAB JV as they are returned to service with acquisition cost of first two planes equal to $40M, inclusive of upgrade costs As aerial firefighting assets become scarcer in the marketplace, Bridger expects increasing demand for Scoopers internationally Potential to grow Bridger fleet to 10 Super Scoopers Spanish Scooper Acquisition to Drive Future Growth Fleet of 4 Aircraft Overview The Addition of Spanish Scoopers is expected to Transform Bridger to the Largest Private Owner of Super Scoopers in the World Target Timeline 2024 /2025 2024/2025 2026 Upgrade and Deploy Plane #1 Upgrade and Deploy Plane #2 Upgrade and Deploy Planes #3 and #4 23
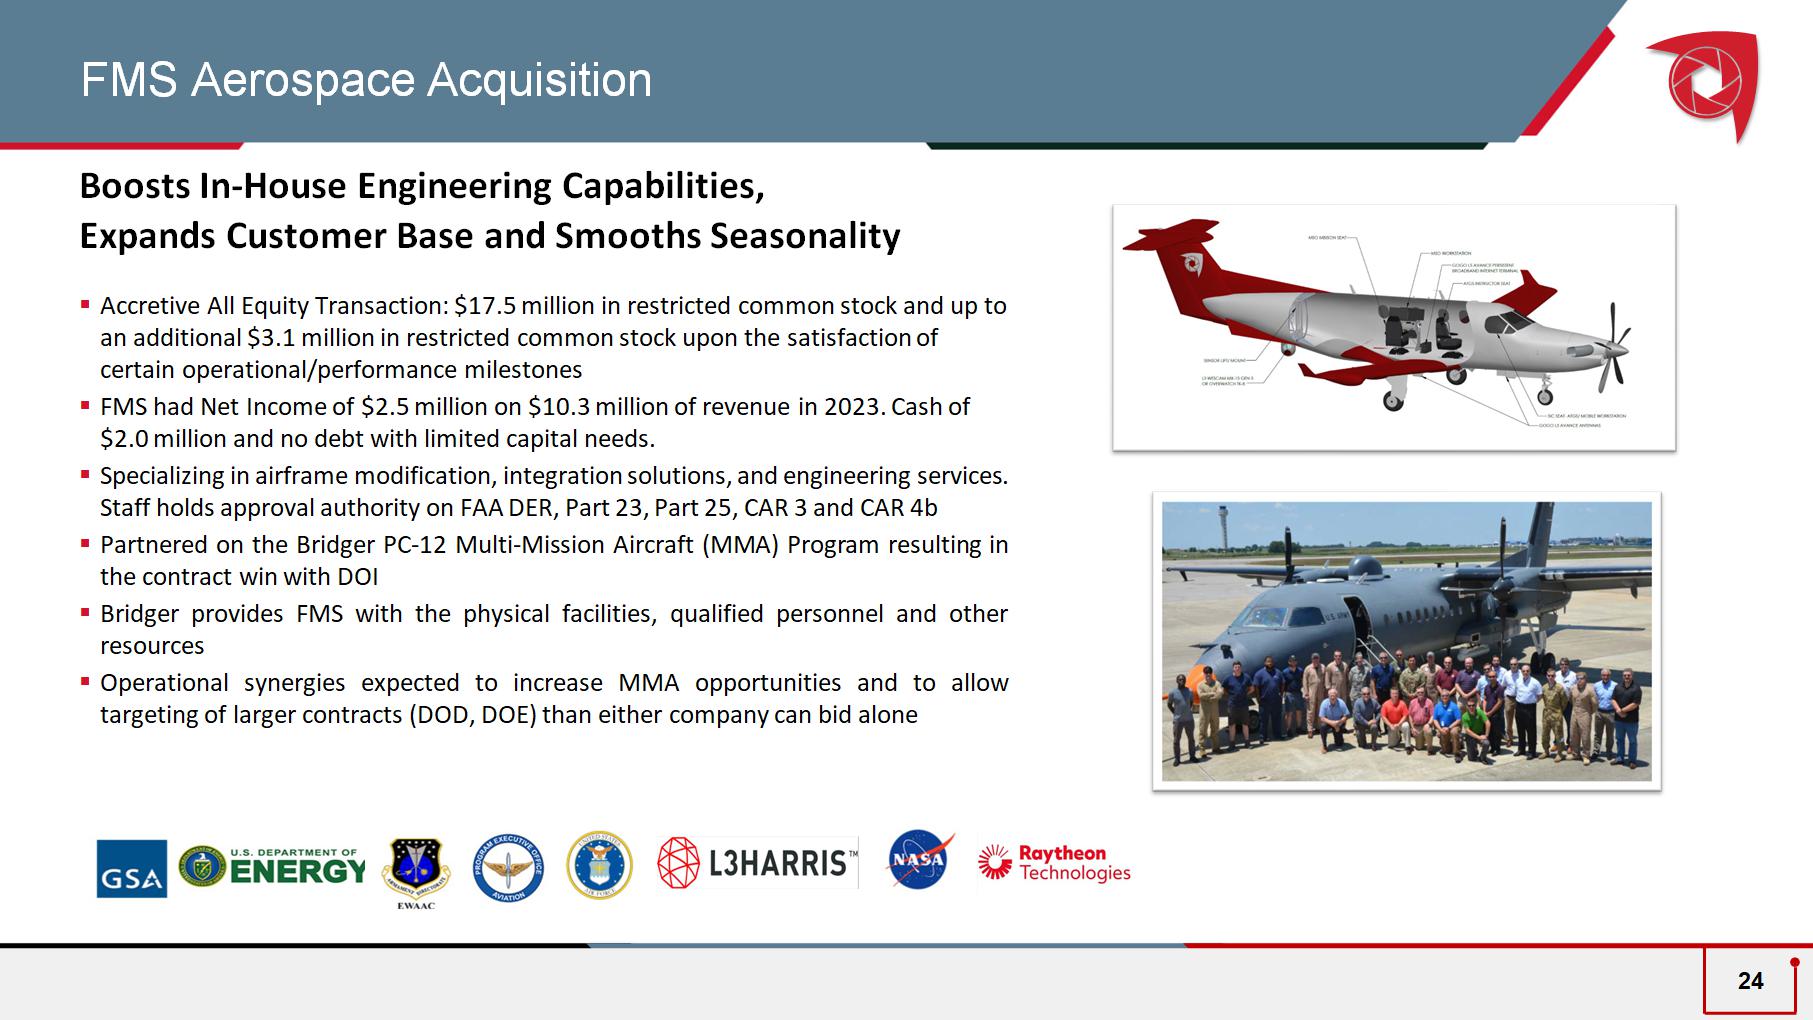
FMS Aerospace Acquisition Boosts In - House Engineering Capabilities, Expands Customer Base and Smooths Seasonality ▪ Accretive All Equity Transaction: $17.5 million in restricted common stock and up to an additional $3.1 million in restricted common stock upon the satisfaction of certain operational/performance milestones ▪ FMS had Net Income of $2.5 million on $10.3 million of revenue in 2023. Cash of $2.0 million and no debt with limited capital needs. ▪ Specializing in airframe modification, integration solutions, and engineering services. Staff holds approval authority on FAA DER, Part 23, Part 25, CAR 3 and CAR 4b ▪ Partnered on the Bridger PC - 12 Multi - Mission Aircraft (MMA) Program resulting in the contract win with DOI ▪ Bridger provides FMS with the physical facilities, qualified personnel and other resources ▪ O perational synergies expected to increase MMA opportunities and to allow targeting of larger contracts (DOD, DOE) than either company can bid alone 24
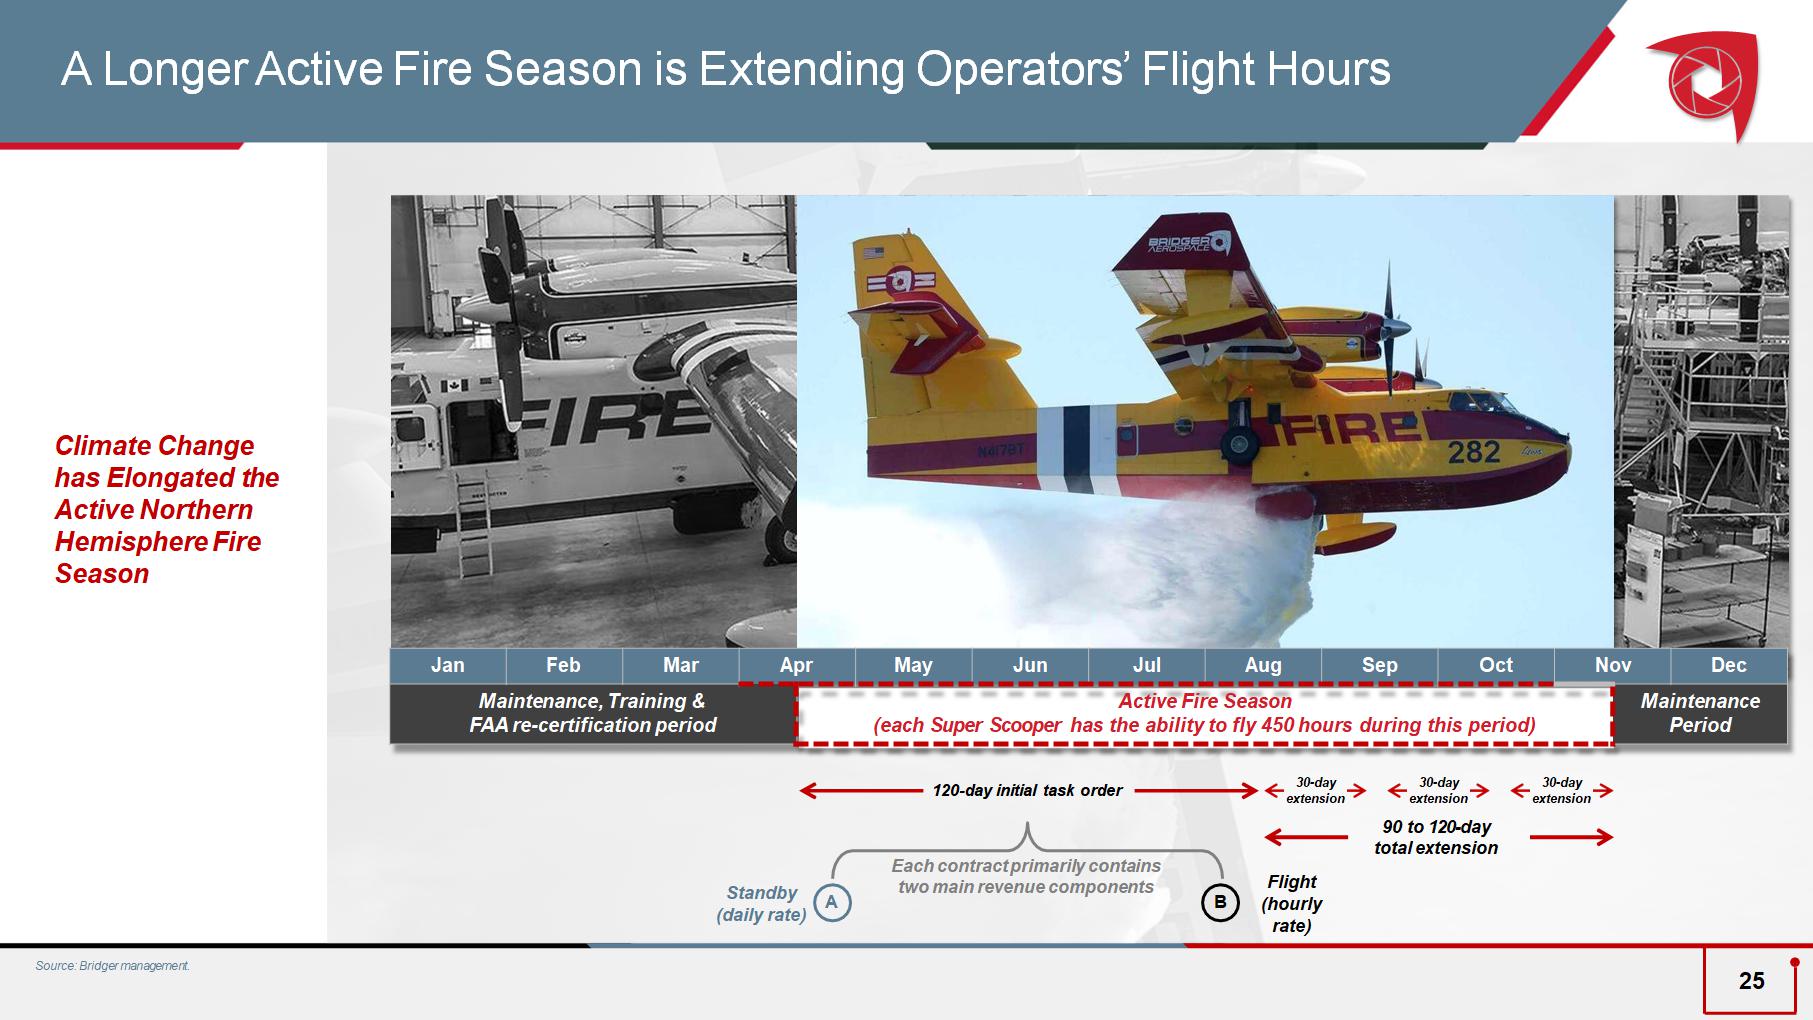
30 - day extension 30 - day extension 90 to 120 - day total extension 30 - day extension 120 - day initial task order Standby (daily rate) Flight (hourly rate) Each contract primarily contains two main revenue components A B Dec Nov Oct Sep Aug Jul Jun May Apr Mar Feb Jan Maintenance Period Active Fire Season (each Super Scooper has the ability to fly 450 hours during this period) Maintenance, Training & FAA re - certification period Source: Bridger management. 25 Climate Change has Elongated the Active Northern Hemisphere Fire Season A Longer Active Fire Season is Extending Operators’ Flight Hours
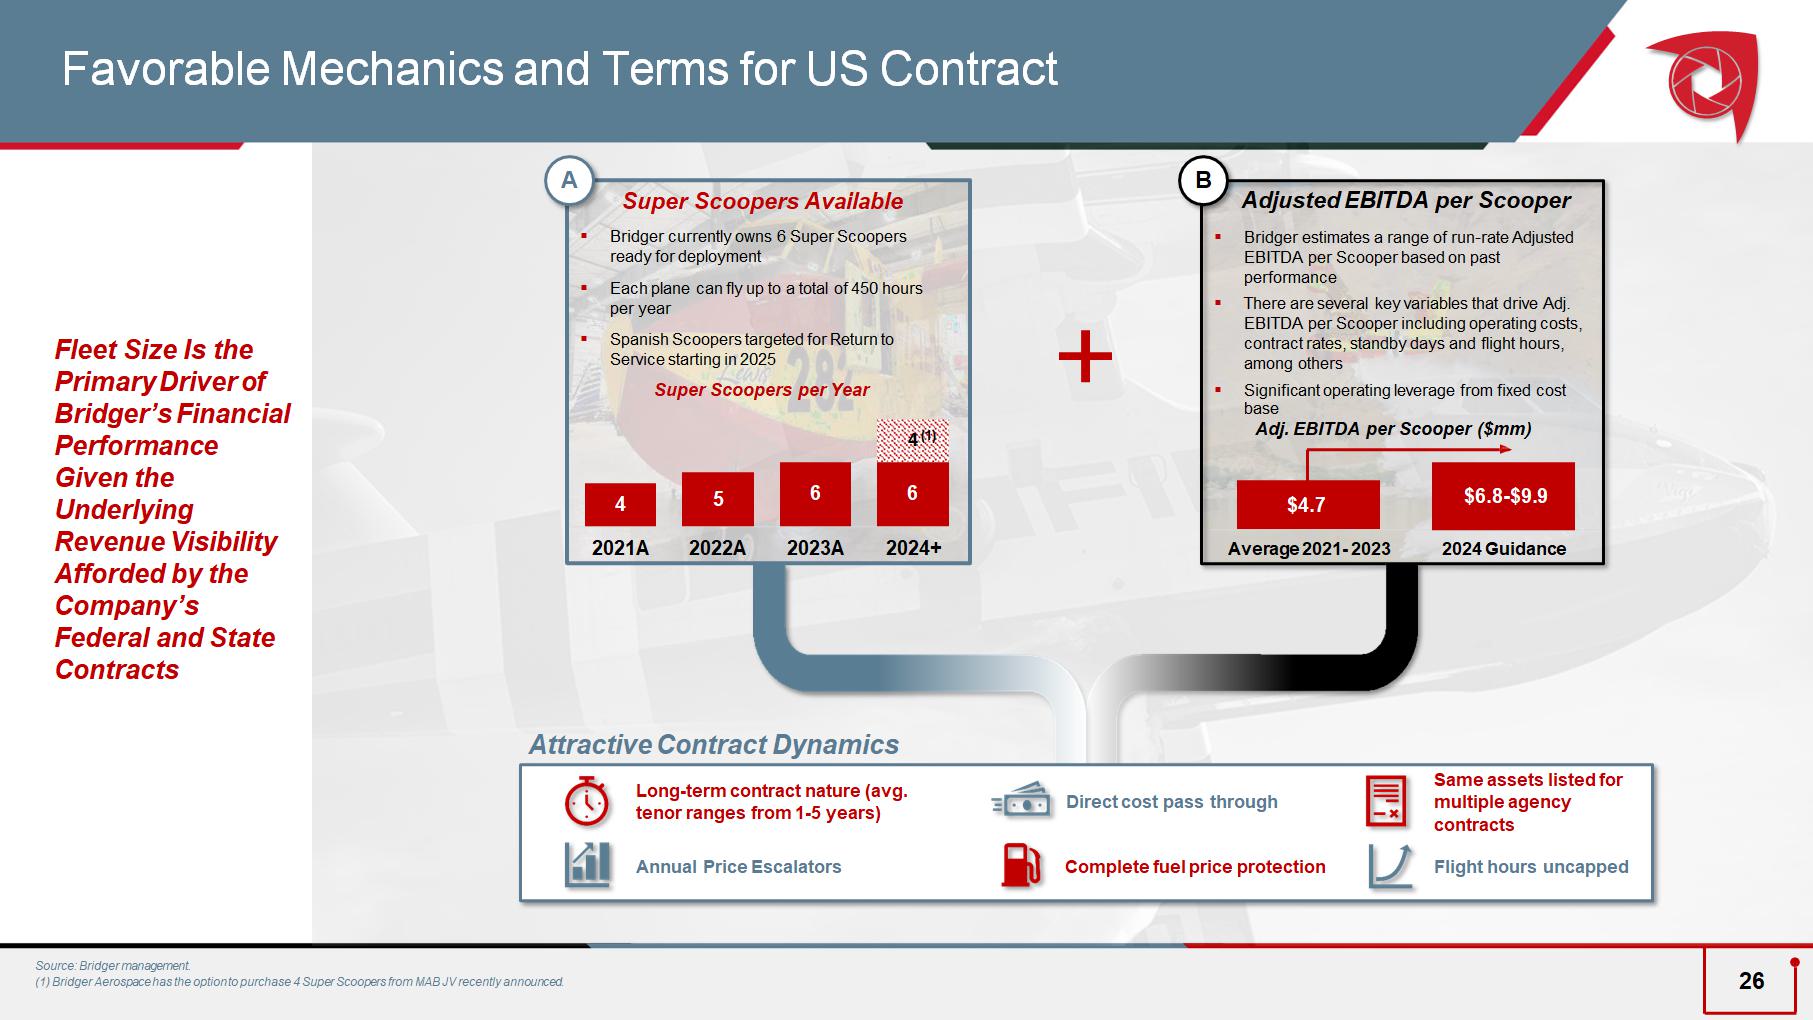
A B Super Scoopers Available ▪ Bridger currently owns 6 Super Scoopers ready for deployment ▪ Each plane can fly up to a total of 450 hours per year ▪ Spanish Scoopers targeted for Return to Service starting in 2025 Long - term contract nature (avg. tenor ranges from 1 - 5 years) Annual Price Escalators Direct cost pass through Complete fuel price protection Same assets listed for multiple agency contracts Flight hours uncapped Favorable Mechanics and Terms for US Contract Fleet Size Is the Primary Driver of Bridger’s Financial Performance Given the Underlying Revenue Visibility Afforded by the Company’s Federal and State Contracts Super Scoopers per Year Attractive Contract Dynamics Adjusted EBITDA per Scooper ▪ Bridger estimates a range of run - rate Adjusted EBITDA per Scooper based on past performance ▪ There are several key variables that drive Adj. EBITDA per Scooper including operating costs, contract rates, standby days and flight hours, among others ▪ Significant operating leverage from fixed cost base Adj. EBITDA per Scooper ($mm) 4 5 6 6 4 2021A 2022A 2023A 2024+ ( 1 ) $ 4.7 $ 6.8 - $9.9 Average 2021 - 2023 2024 Guidance Source: Bridger management. (1) Bridger Aerospace has the option to purchase 4 Super Scoopers from MAB JV recently announced. 26
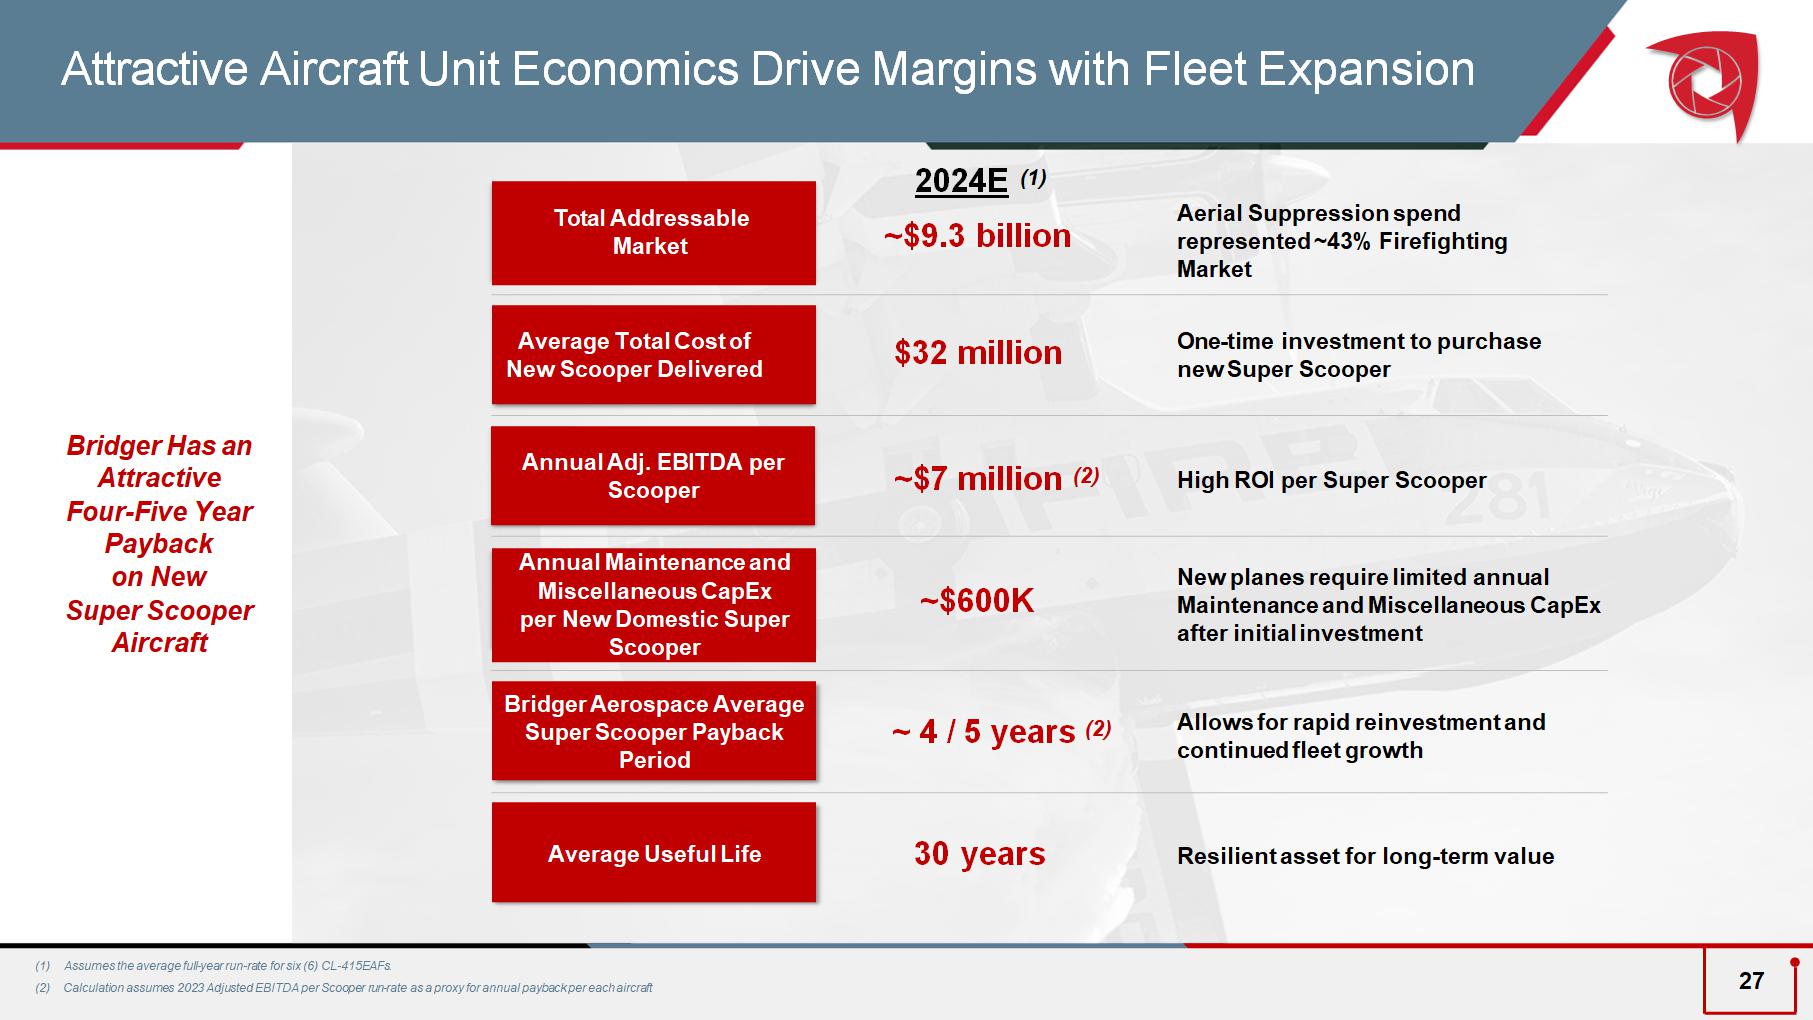
(1) Assumes the average full - year run - rate for six (6) CL - 415EAFs. $32 million One - time investment to purchase new Super Scooper Average Total Cost of New Scooper Delivered Bridger Aerospace Average Super Scooper Payback Period ~ 4 / 5 years (2) Allows for rapid reinvestment and continued fleet growth Annual Maintenance and Miscellaneous CapEx per New Domestic Super Scooper ~$600K New planes require limited annual Maintenance and Miscellaneous CapEx after initial investment Bridger Has an Attractive Four - Five Year Payback on New Super Scooper Aircraft Attractive Aircraft Unit Economics Drive Margins with Fleet Expansion 2024E (1) ~$9.3 billion Aerial Suppression spend represented ~43% Firefighting Market Total Addressable Market Annual Adj. EBITDA per Scooper ~$7 million (2) High ROI per Super Scooper Average Useful Life 30 years Resilient asset for long - term value 27 (2) Calculation assumes 2023 Adjusted EBITDA per Scooper run - rate as a proxy for annual payback per each aircraft
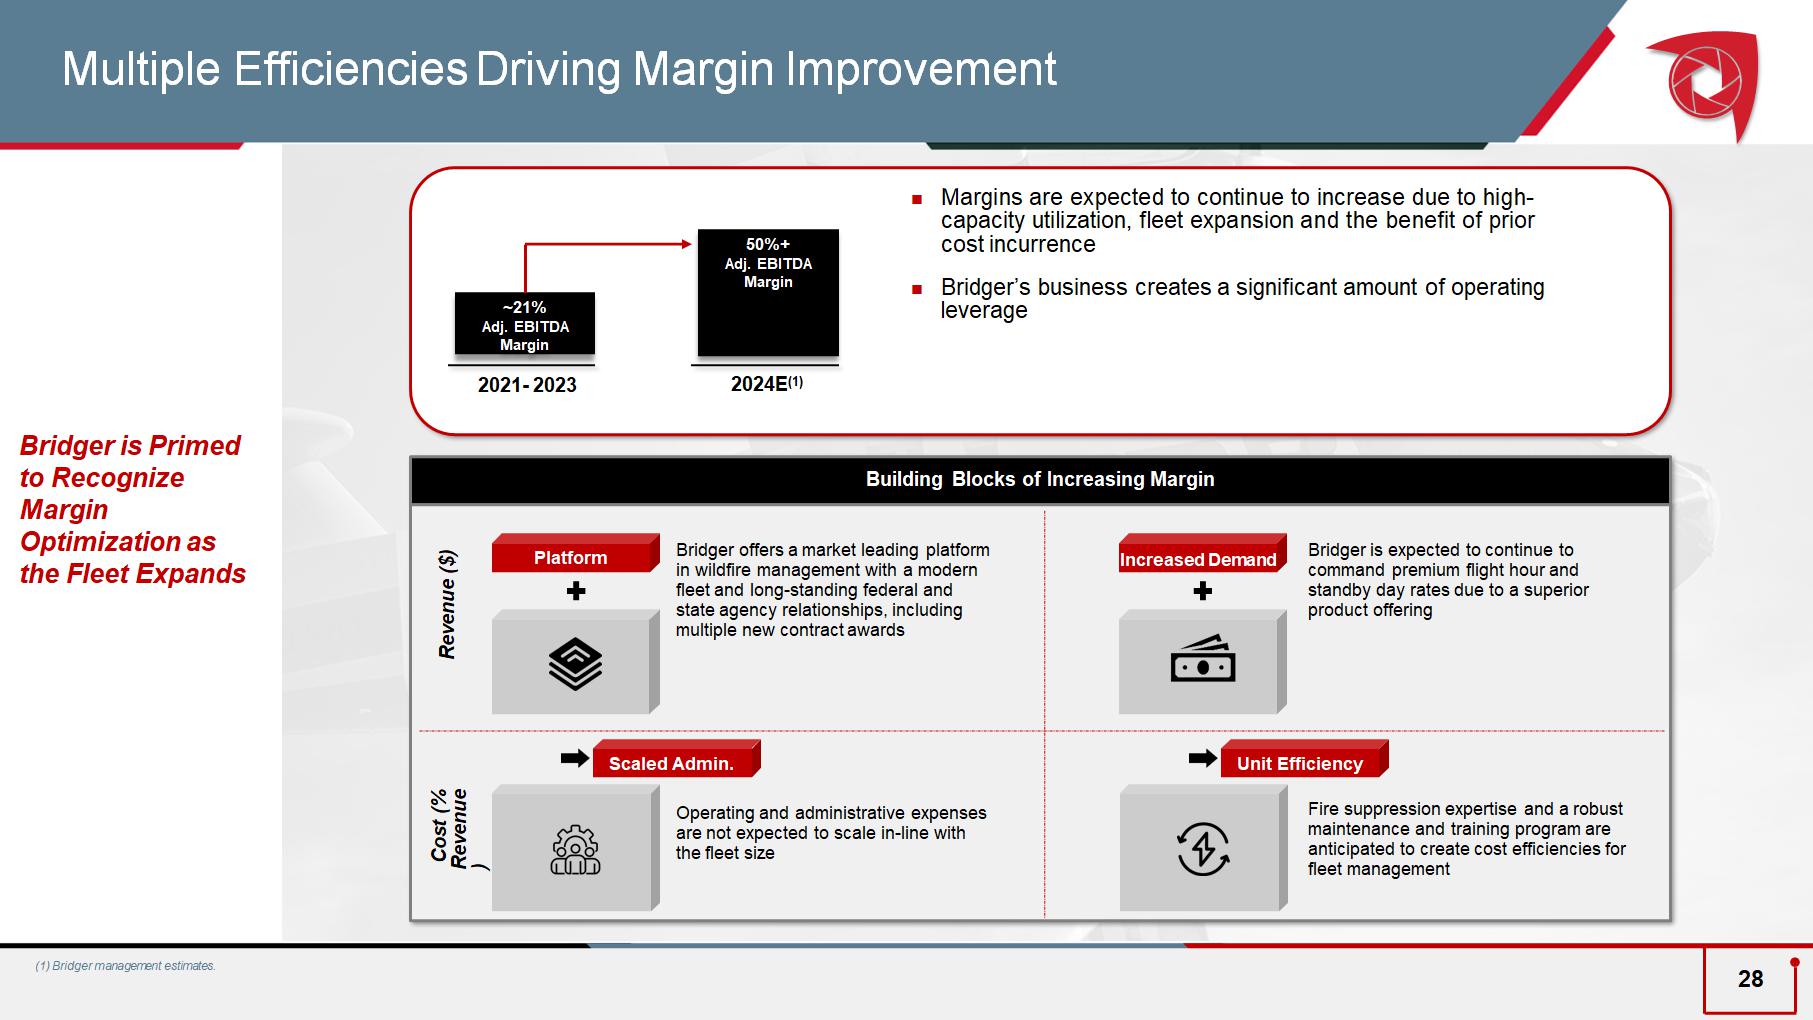
Building Blocks of Increasing Margin Margins are expected to continue to increase due to high - capacity utilization, fleet expansion and the benefit of prior cost incurrence; Bridger ’s business creates a significant amount of operating leverage Bridger offers a market leading platform in wildfire management with a modern fleet and long - standing federal and state agency relationships, including multiple new contract awards Bridger is expected to continue to command premium flight hour and standby day rates due to a superior product offering Operating and administrative expenses are not expected to scale in - line with the fleet size Fire suppression expertise and a robust maintenance and training program are anticipated to create cost efficiencies for fleet management Platform Increased Demand Scaled Admin. Unit Efficiency ~2 1 % Adj. EBITDA Margin 2021 - 2023 2024E (1) Revenue ($) 5 0 %+ Adj. EBITDA Margin Cost (% Revenue ) Multiple Efficiencies Driving Margin Improvement Bridger is Primed to Recognize Margin Optimization as the Fleet Expands (1) Bridger management estimates. 28
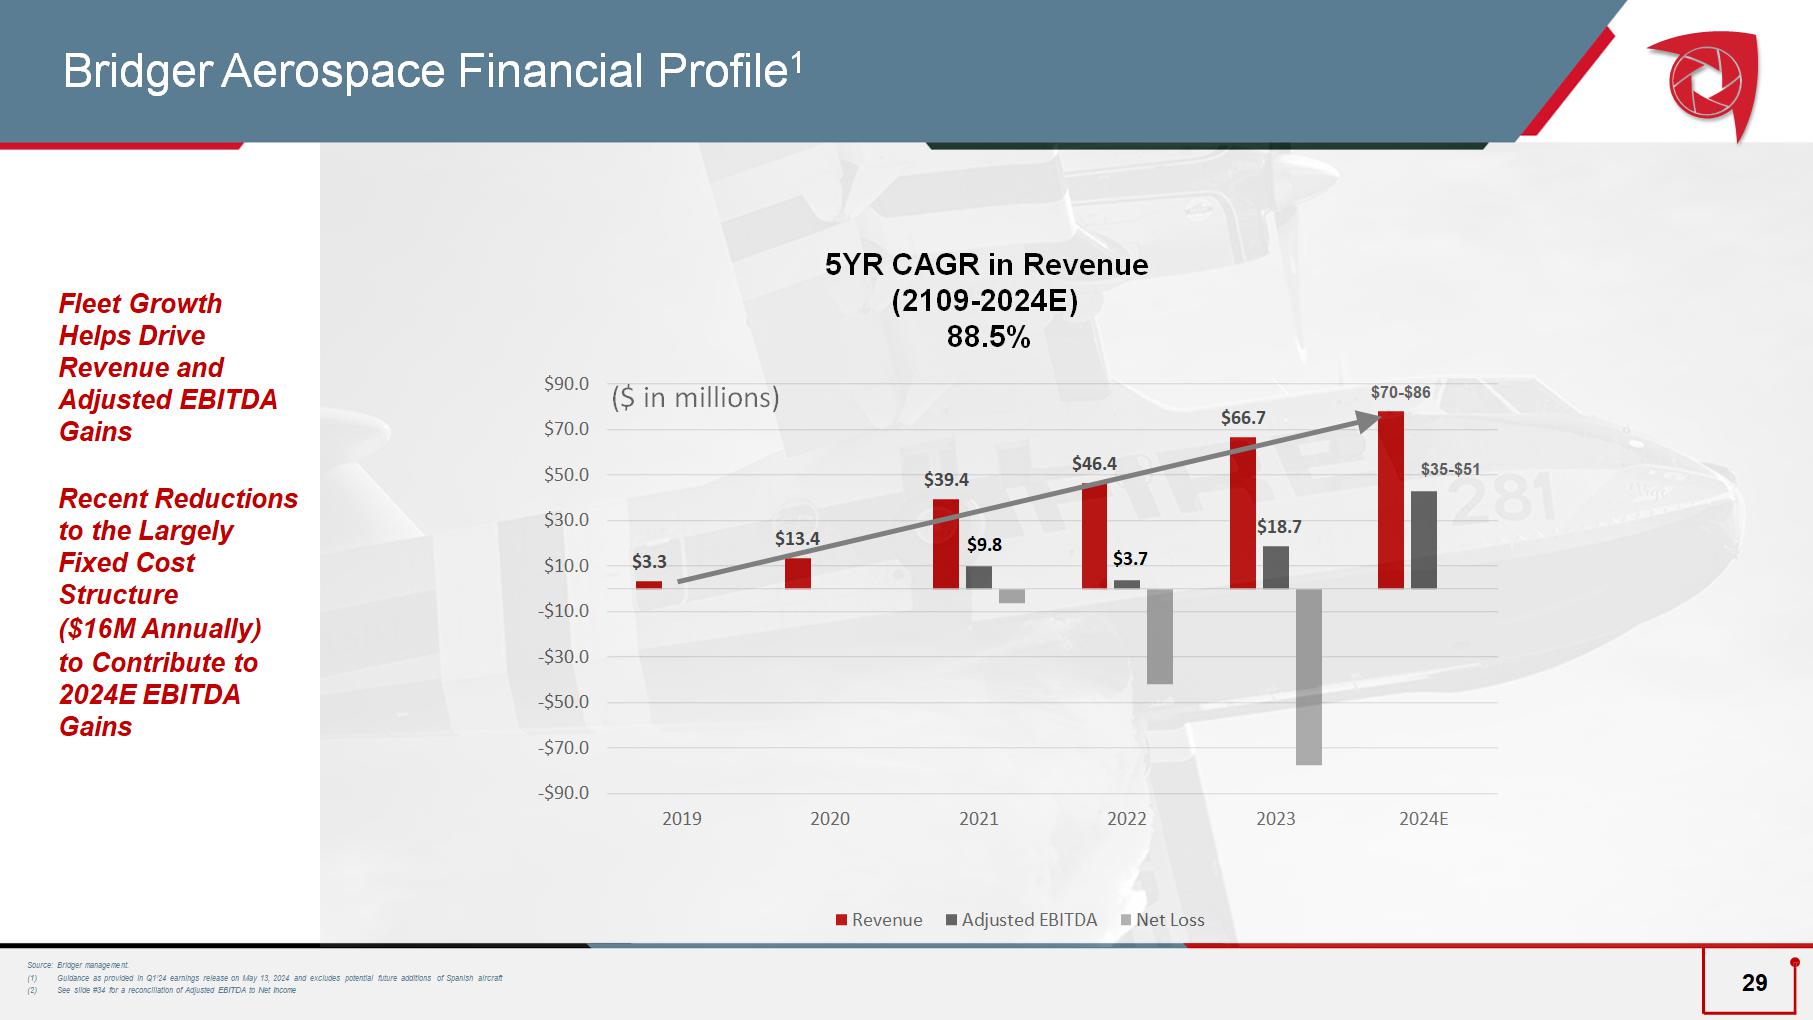
$3.3 $13.4 $39.4 $46.4 $66.7 $18.7 -$90.0 -$70.0 -$50.0 -$30.0 -$10.0 $10.0 $30.0 $50.0 $70.0 $90.0 2019 2020 2021 2022 2023 2024E ($ in millions) Revenue Adjusted EBITDA Net Loss Source: Bridger management. (1) Guidance as provided in Q1’24 earnings release on May 13, 2024 and excludes potential future additions of Spanish aircraft (2) See slide #34 for a reconciliation of Adjusted EBITDA to Net Income Fleet Growth Helps Drive Revenue and Adjusted EBITDA Gains Recent Reductions to the Largely Fixed Cost Structure ($16M Annually) to Contribute to 2024E EBITDA Gains Bridger Aerospace Financial Profile 1 $ 70 - $86 $35 - $51 29 5YR CAGR in Revenue (2109 - 2024E) 88.5% $9.8 $3.7
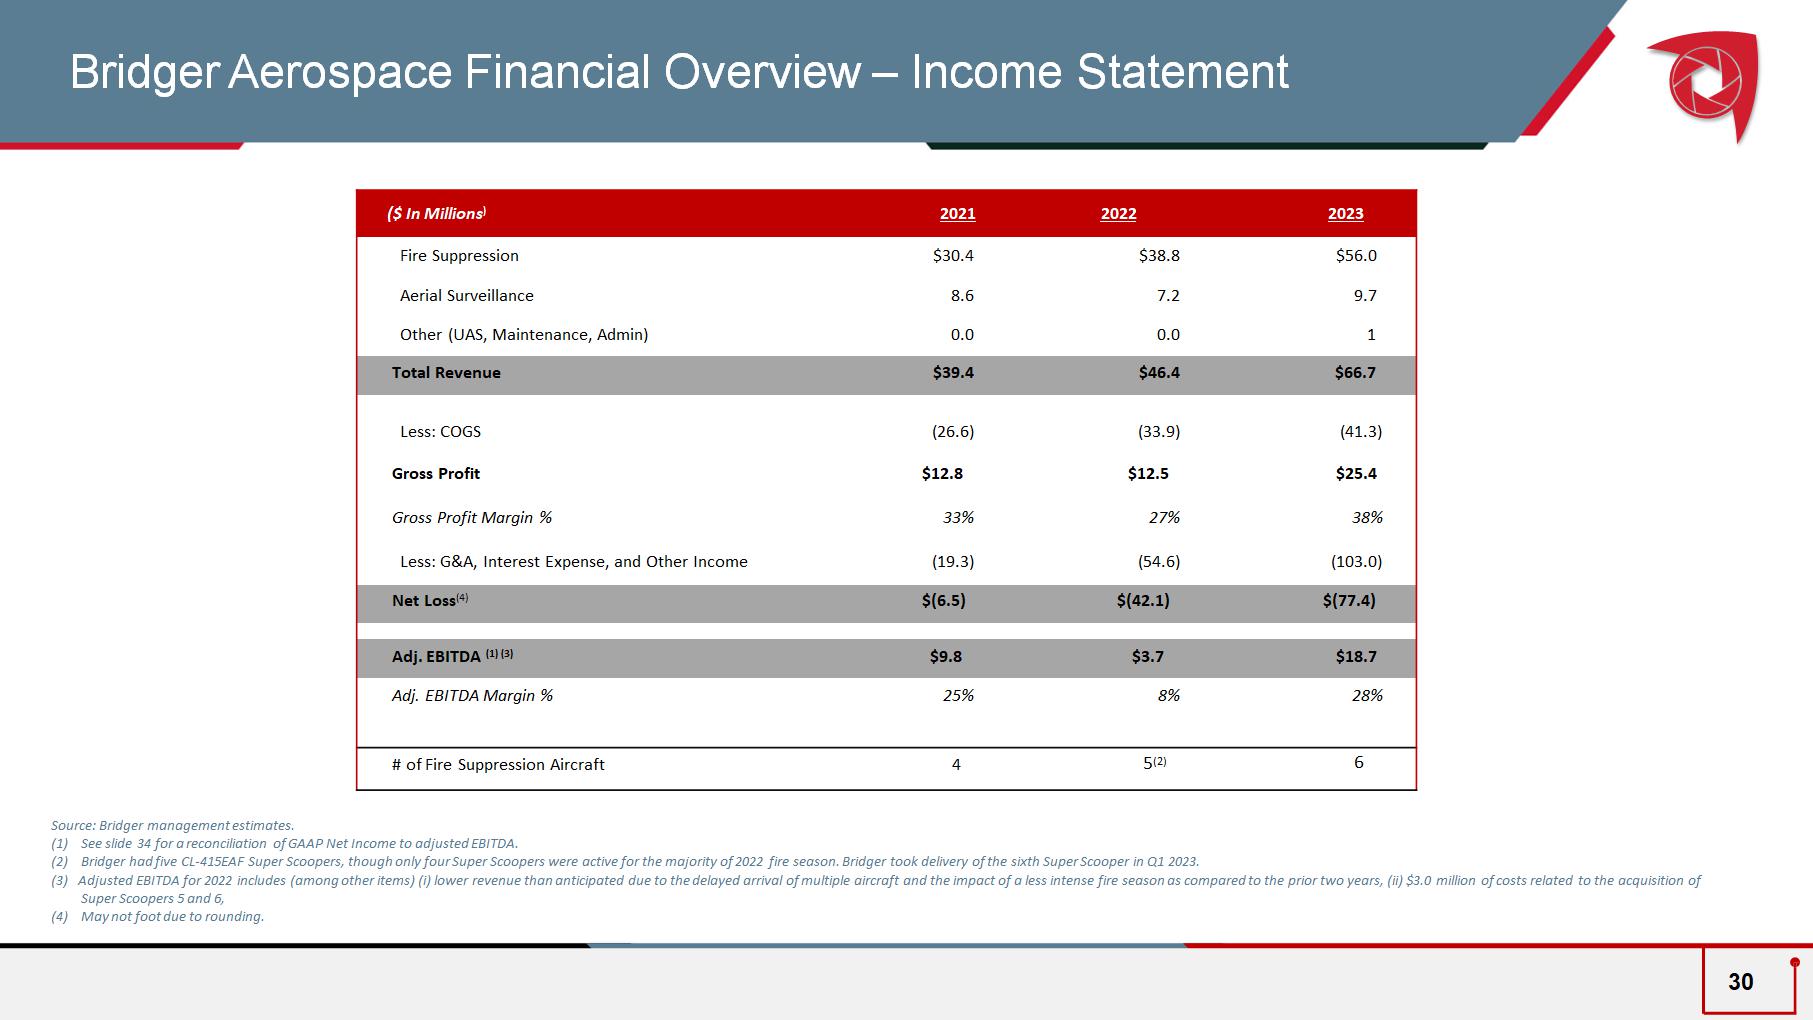
2023 2022 2021 ($ In Millions ) $ 56.0 $ 38.8 $30 .4 Fire Suppression 9.7 7 .2 8 .6 Aerial Surveillance 1 0. 0 0 .0 Other ( UAS, Maintenance, Admin) $ 66.7 $46 .4 $39 .4 Total Revenue ( 41.3 ) ( 33.9 ) (26 .6 ) Less: COGS $ 25.4 $12 .5 $ 12.8 Gross Profit 38 % 2 7 % 33% Gross Profit Margin % ( 103.0 ) (5 4.6 ) (19 .3 ) Less: G&A, Interest Expense, and Other Income $ (77.4) $(4 2.1 ) $( 6.5 ) Net L oss ( 4) $ 18.7 $ 3.7 $ 9.8 Adj. EBITDA (1) ( 3 ) 28 % 8 % 25 % Adj. EBITDA Margin % 6 5 (2 ) 4 # of Fire Suppression Aircraft Source: Bridger management estimates. (1) See slide 34 for a reconciliation of GAAP Net Income to adjusted EBITDA. (2) Bridger had five CL - 415EAF Super Scoopers, though only four Super Scoopers were active for the majority of 2022 fire season. Bridger took delivery of the sixth Super Scooper in Q1 2023. (3) Adjusted EBITDA for 2022 includes (among other items) (i) lower revenue than anticipated due to the delayed arrival of multiple aircraft and the impact of a less intense fire season as compared to the prior two years, (ii) $3.0 million of costs related to the acquisition of Super Scoopers 5 and 6, (4) May not foot due to rounding. Bridger Aerospace Financial Overview – Income Statement 30
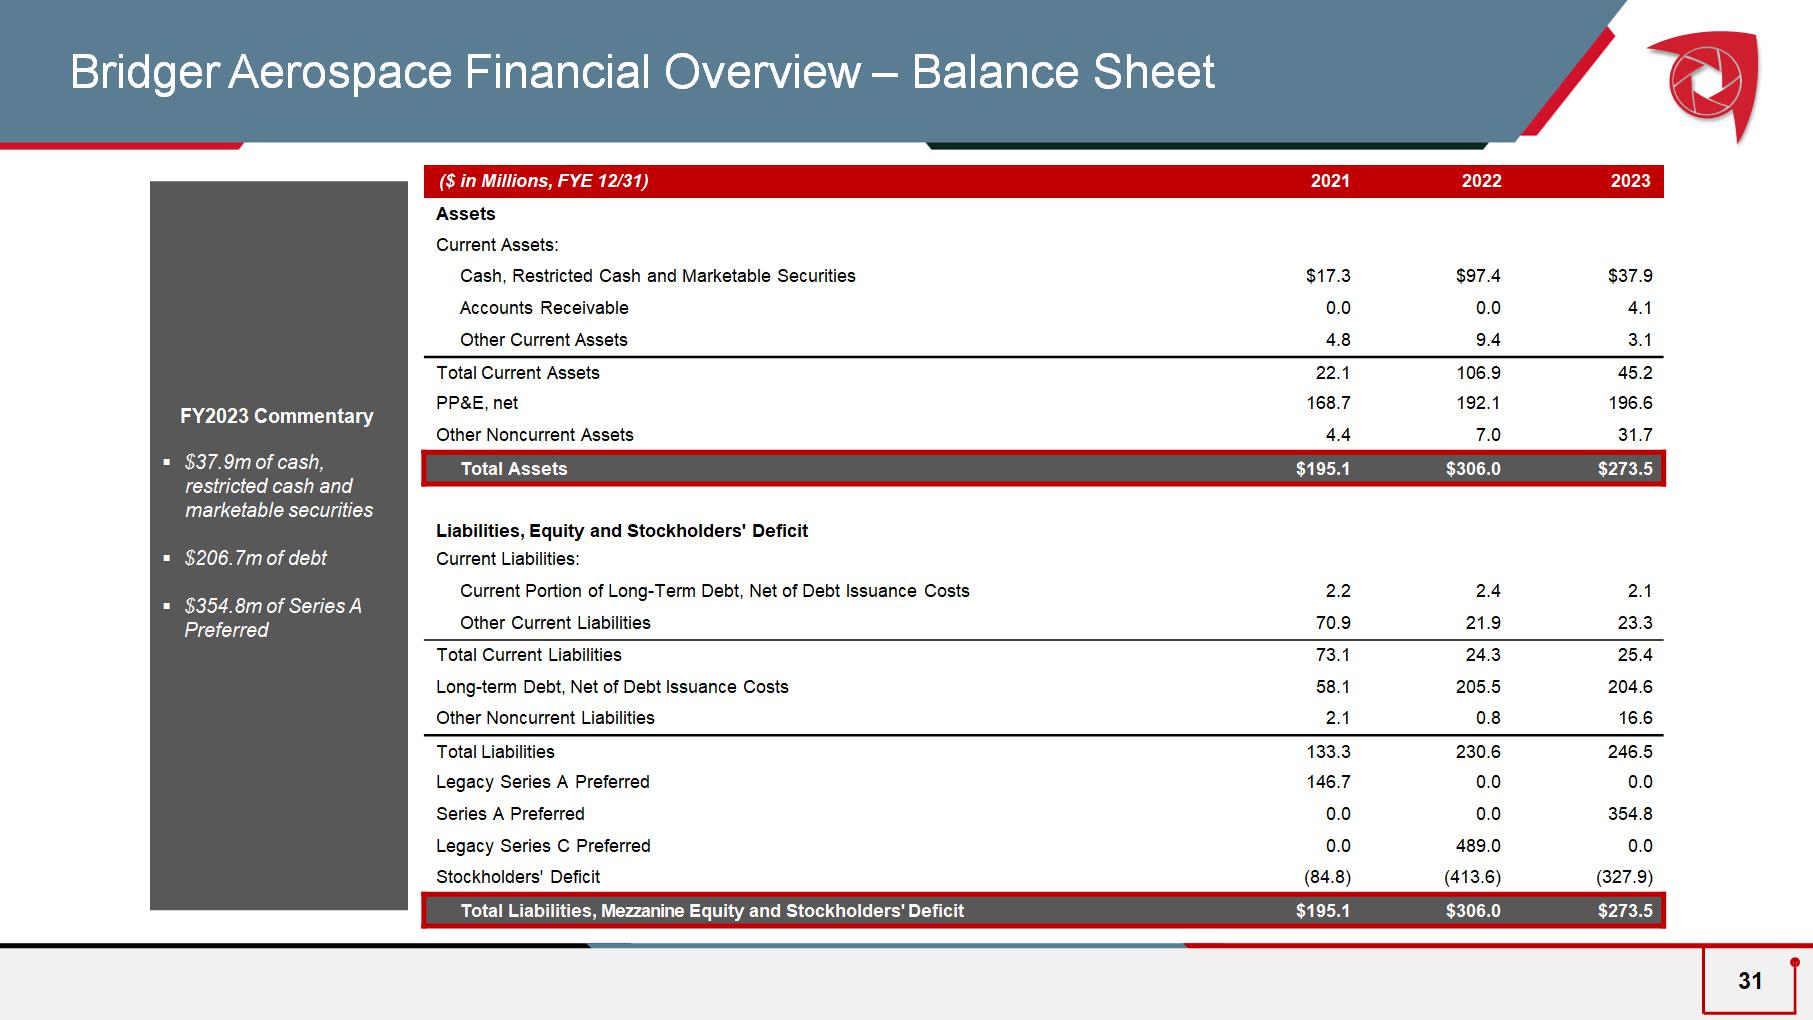
Bridger Aerospace Financial Overview – Balance Sheet FY 2023 Commentary ▪ $ 37.9 m of cash, restricted cash and marketable securities ▪ $206.7m of debt ▪ $354.8m of Series A Preferred 2023 2022 2021 ($ in Millions , FYE 12/31) Assets Current Assets: $37.9 $97.4 $17.3 Cash, Restricted Cash a n d Marketable Securities 4.1 0.0 0.0 Accounts Receivable 3.1 9.4 4.8 Other Current Assets 45.2 106.9 22.1 Total Current Assets 196.6 192.1 168.7 PP&E , net 31.7 7.0 4.4 Other Noncurrent Assets $ 273.5 $306.0 $195.1 Total Assets Liabilities, Equity and Stockholders ' Deficit Current Liabilities: 2.1 2.4 2.2 Current Portion of Long - Term Debt, Net of Debt Issuance Costs 23.3 21.9 70.9 Other Current Liabilities 25.4 24.3 73.1 Total Current Liabilities 204.6 205.5 58.1 Long - term Debt, Net of Debt Issuance Costs 16.6 0.8 2.1 Other Noncurrent Liabilities 246.5 230.6 133.3 Total Liabilities 0.0 0.0 146.7 Legacy Series A Preferred 354.8 0.0 0.0 Series A Preferred 0.0 489.0 0.0 Legacy Series C Preferred ( 327.9 ) (41 3.6 ) (84.8) Stockholders ' Deficit $273.5 $306.0 $195.1 Total Liabilities, Mezzanine Equity and Stockholders ' Deficit 31
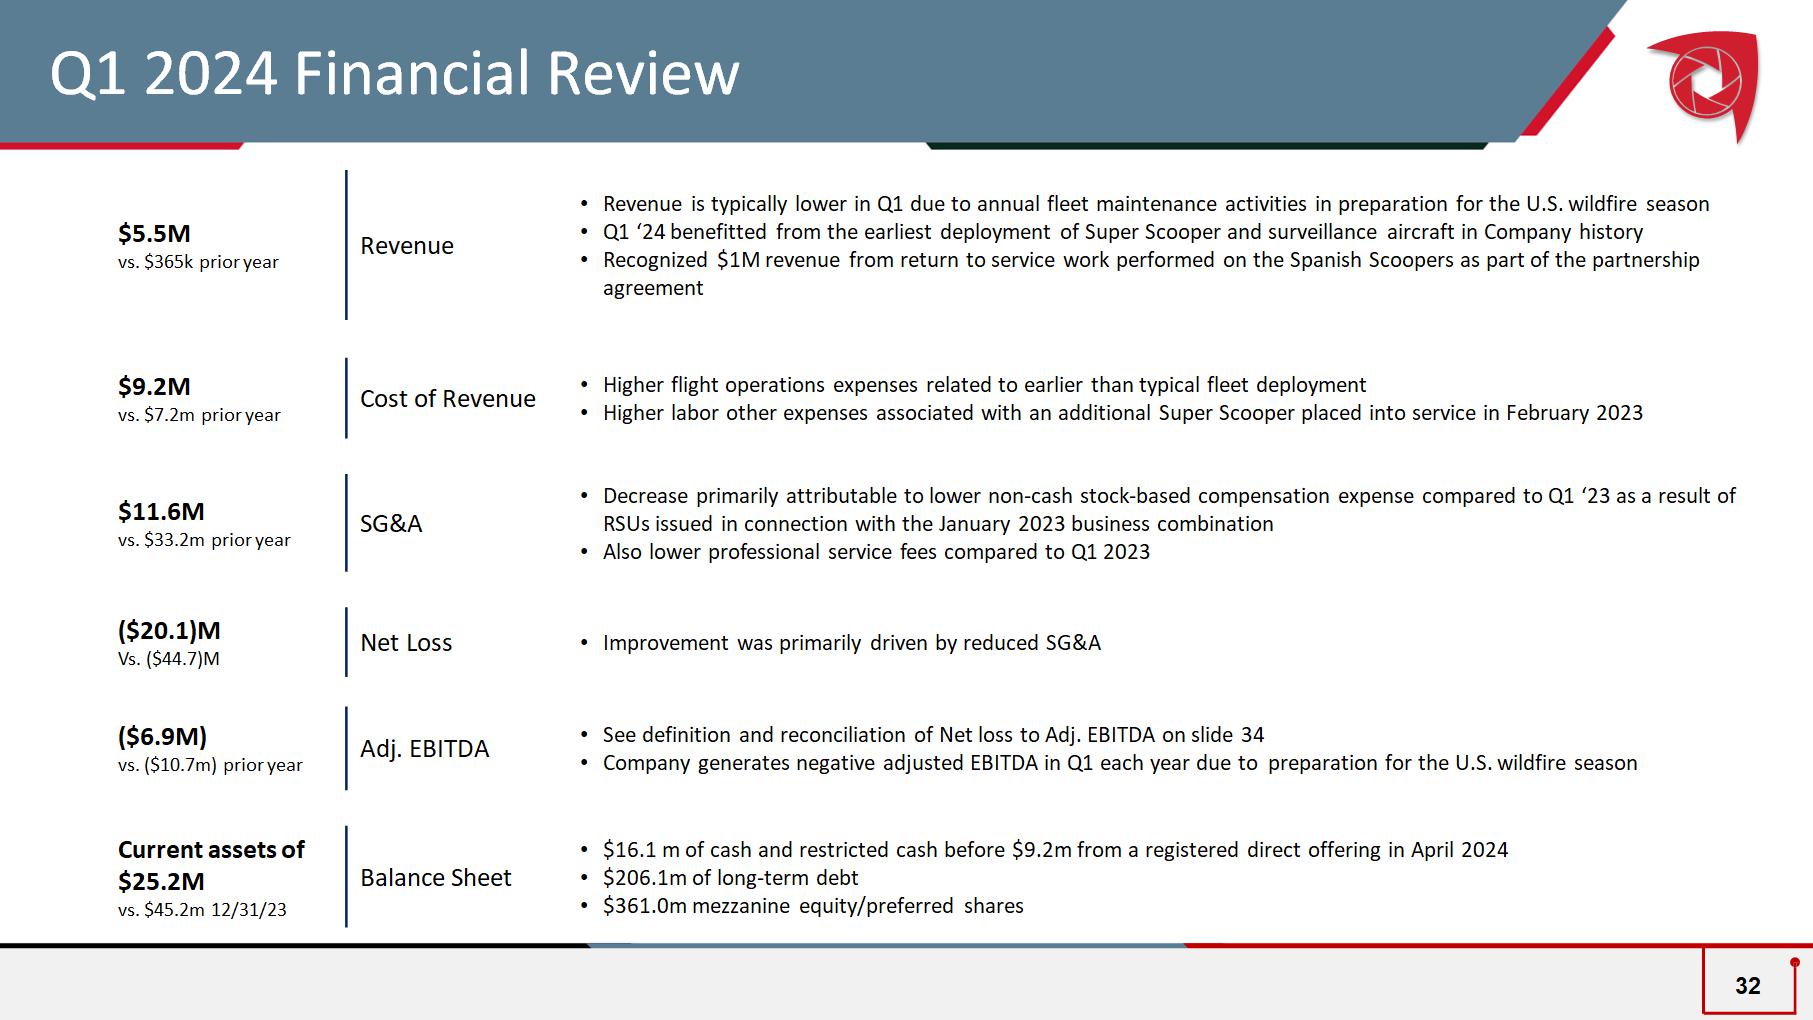
Q1 2024 Financial Review • Revenue is typically lower in Q1 due to annual fleet maintenance activities in preparation for the U.S. wildfire season • Q1 ‘24 benefitted from the earliest deployment of Super Scooper and surveillance aircraft in Company history • Recognized $1M revenue from return to service work performed on the Spanish Scoopers as part of the partnership agreement Revenue $5.5M vs. $365k prior year • Higher flight operations expenses related to earlier than typical fleet deployment • Higher labor other expenses associated with an additional Super Scooper placed into service in February 2023 Cost of Revenue $9.2M vs. $7.2m prior year • Decrease primarily attributable to lower non - cash stock - based compensation expense compared to Q1 ‘23 as a result of RSUs issued in connection with the January 2023 business combination • Also lower professional service fees compared to Q1 2023 SG&A $11.6M vs. $33.2m prior year • Improvement was primarily driven by reduced SG&A Net Loss ($20.1)M Vs. ($44.7)M • See definition and reconciliation of Net loss to Adj. EBITDA on slide 34 • Company generates negative adjusted EBITDA in Q1 each year due to preparation for the U.S. wildfire season Adj. EBITDA ($6.9M) vs. ($10.7m) prior year • $16.1 m of cash and restricted cash before $9.2m from a registered direct offering in April 2024 • $206.1m of long - term debt • $361.0m mezzanine equity/preferred shares Balance Sheet Current assets of $25.2M vs. $45.2m 12/31/23 32
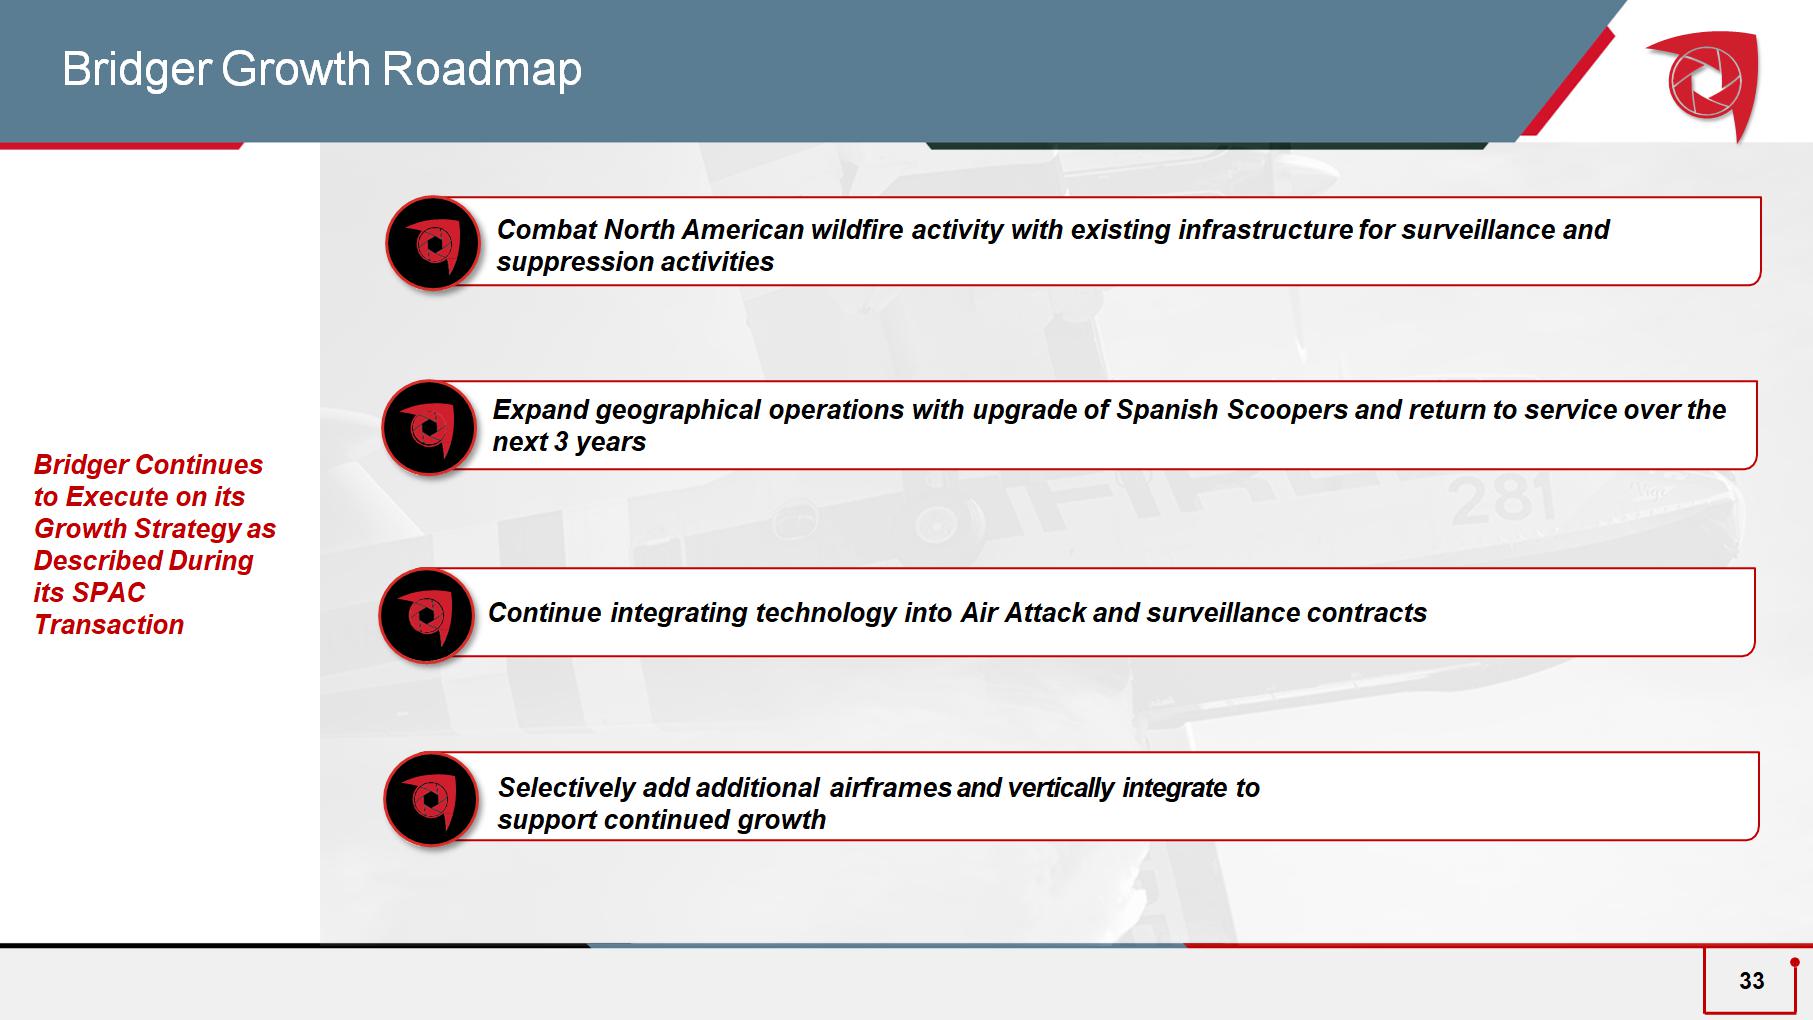
Bridger Growth Roadmap Expand geographical operations with upgrade of Spanish Scoopers and return to service over the next 3 years Combat N orth American wildfire activity with existing infrastructure for surveillance and suppression activities Bridger Continues to Execute on its Growth Strategy as Described During its SPAC Transaction Continue integrating technology into Air Attack and surveillance contracts Selectively add additional airframes and vertically integrate to support continued growth 33
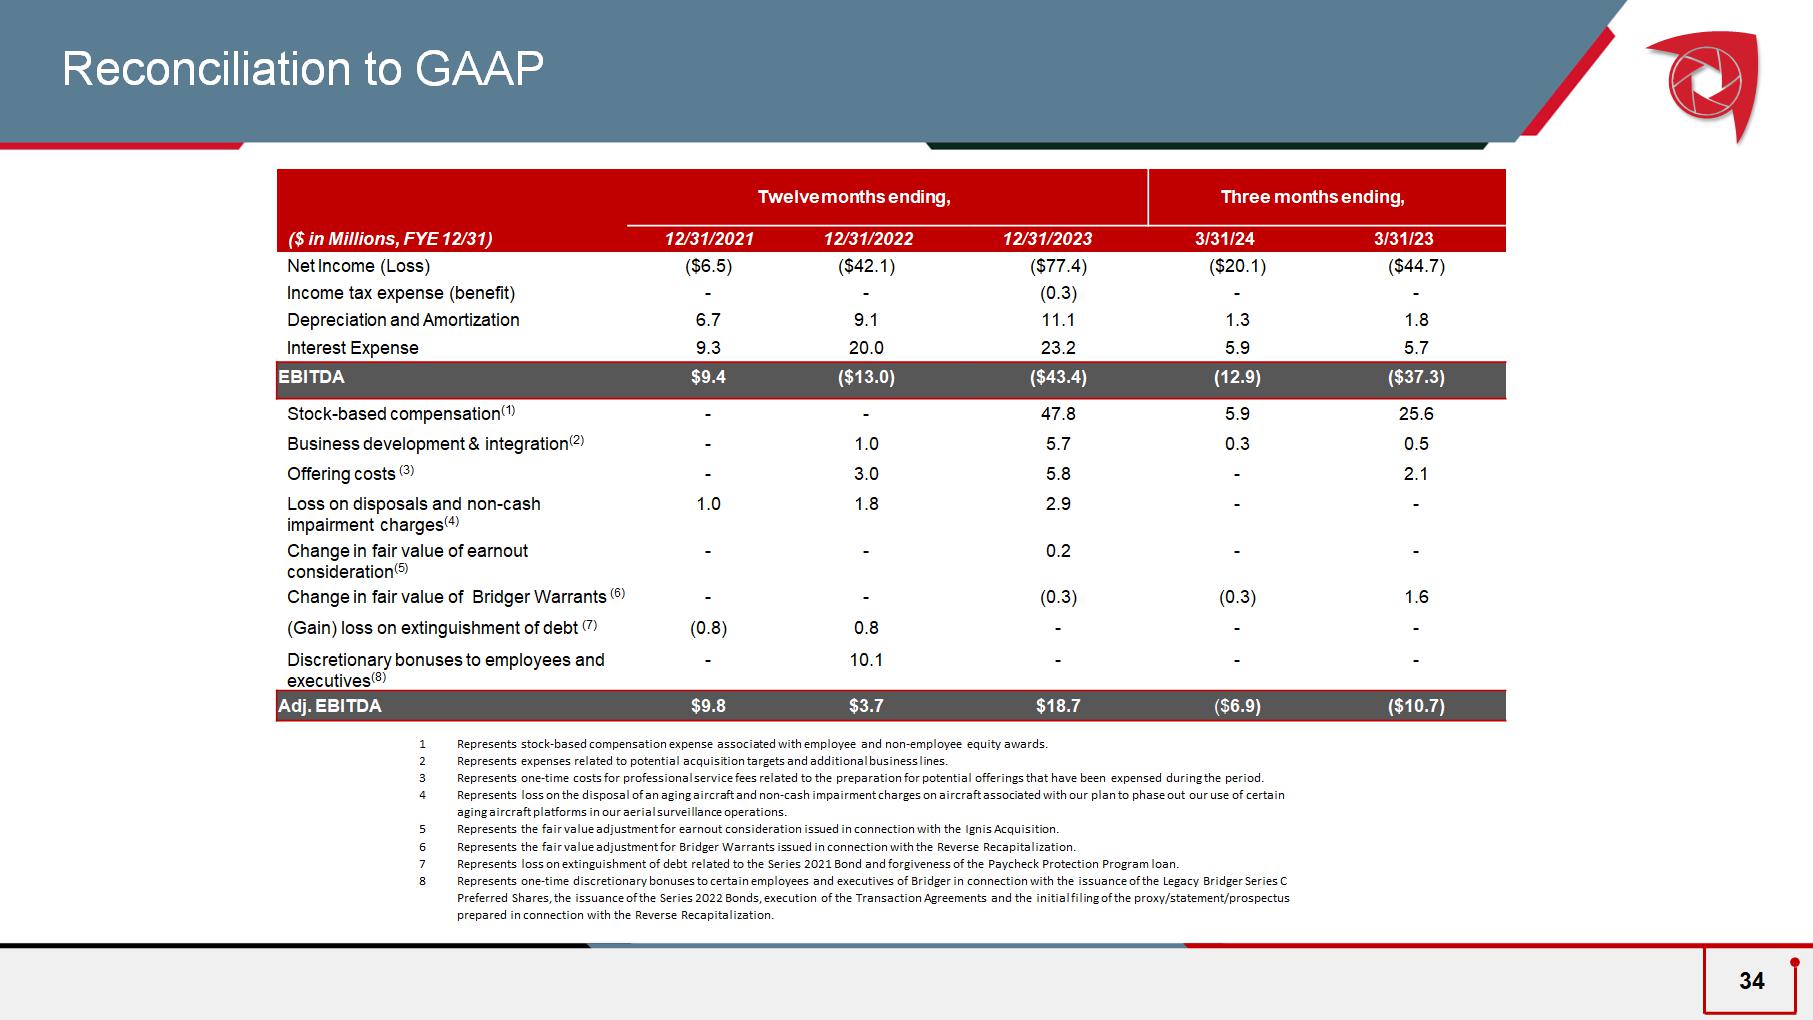
Three months ending, Twelve months ending, 3/31/23 3/31/24 12/31/2023 12/31/2022 12/31/202 1 ($ in Millions, FYE 12/31) ($44.7) ($20.1) ($ 77.4 ) ($42.1) ($ 6.5 ) Net Income (Loss) - - (0.3) - - Income tax expense (benefit) 1.8 1.3 11.1 9.1 6.7 Depreciation and Amortization 5.7 5.9 23.2 20.0 9.3 Interest Expense ($37.3) (12.9) ( $ 43.4) ($13.0) $9.4 EBITDA 25.6 5.9 47.8 - - Stock - based compensation (1) 0.5 0.3 5.7 1.0 - Business development & integration (2) 2.1 - 5.8 3.0 - Offering costs (3) - - 2.9 1.8 1.0 L oss on disposals and non - cash impairment charges (4) - - 0.2 - - Change in fair value of earnout consideration (5) 1.6 (0.3) (0.3) - - Change in fair value of Bridger Warrants (6) - - - 0.8 (0.8) (Gain) loss on extinguishment of debt (7) - - - 10.1 - Discretionary bonuses to employees and executives ( 8 ) ($10.7) ($ 6.9) $ 18.7 $3.7 $ 9.8 Adj. EBITDA 34 Reconciliation to GAAP 1 Represents stock - based compensation expense associated with employee and non - employee equity awards. 2 Represents expenses related to potential acquisition targets and additional business lines. 3 Represents one - time costs for professional service fees related to the preparation for potential offerings that have been expe nsed during the period. 4 Represents loss on the disposal of an aging aircraft and non - cash impairment charges on aircraft associated with our plan to p hase out our use of certain aging aircraft platforms in our aerial surveillance operations. 5 Represents the fair value adjustment for earnout consideration issued in connection with the Ignis Acquisition. 6 Represents the fair value adjustment for Bridger Warrants issued in connection with the Reverse Recapitalization. 7 Represents loss on extinguishment of debt related to the Series 2021 Bond and forgiveness of the Paycheck Protection Program l oan. 8 Represents one - time discretionary bonuses to certain employees and executives of Bridger in connection with the issuance of th e Legacy Bridger Series C Preferred Shares, the issuance of the Series 2022 Bonds, execution of the Transaction Agreements and the initial filing of th e p roxy/statement/prospectus prepared in connection with the Reverse Recapitalization.