Exhibit 99.2
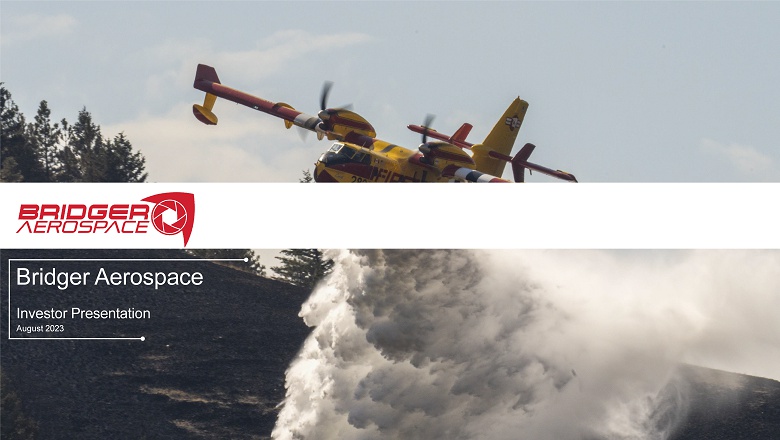
Bridger Aerospace Investor Presentation August 2023
Basis of Presentation This Presentation (this “Presentation”) is provided for informational purposes only and has been prepared to assist intereste d p arties in making their own evaluation with respect to an investment opportunity in Bridger Aerospace Group Holdings, Inc. (“Bridger”, “Bridger Aerospace” or the “Company”) and for no other purp ose . By accepting, reviewing or reading this Presentation, you will be deemed to have agreed to the obligations and restrictions set out below. No Offer or Solicitation This Presentation and any oral statements made in connection with this Presentation do not constitute an offer to sell, or a sol icitation of an offer to buy, or a recommendation to purchase, any securities in any jurisdiction, nor shall there be any sale, issuance or transfer of any securities in any jurisdiction where, or to any pe rson to whom, such offer, solicitation or sale may be unlawful under the laws of such jurisdiction. This Presentation does not constitute either advice or a recommendation regarding any securities. No offer ing of securities shall be made except by means of a prospectus meeting the requirements of the Securities Act of 1933, as amended, or an exemption therefrom. Industry and Market Data No representations or warranties, express, implied or statutory are given in, or in respect of, this Presentation, and no per son may rely on the information contained in this Presentation. To the fullest extent permitted by law, in no circumstances will Bridger or any of its respective subsidiaries, stockholders, affiliates, re pre sentatives, partners, directors, officers, employees, advisers or agents be responsible or liable for any direct, indirect or consequential loss or loss of profit arising from the use of this Presentat ion , its contents, its omissions, reliance on the information contained within it or on opinions communicated in relation thereto or otherwise arising in connection therewith. This Presentation discusses trends an d m arkets that Bridger’s leadership team believes will impact the development and success of Bridger based on its current understanding of the marketplace. Industry and market data used in th is Presentation have been obtained from third - party industry publications and sources as well as from research reports prepared for other purposes. Bridger has not independently verified the data obt ain ed from these sources and cannot assure you of the reasonableness of any assumptions used by these sources or the data’s accuracy or completeness. Any data on past performance or modeling contai ned herein is not an indication as to future performance. This data is subject to change. Recipients of this Presentation are not to construe its contents, or any prior or subsequent communication s f rom Bridger or its respective representatives as investment, legal or tax advice. The Recipient should seek independent third party legal, regulatory, accounting and/or tax advice regarding this Pres ent ation. In addition, this Presentation does not purport to be all - inclusive or to contain all of the information that may be required to make a full analysis of Bridger. Recipients of this Presentation sh oul d each make their own evaluation of Bridger and of the relevance and adequacy of the information and should make such other investigations as they deem necessary. Bridger assumes no obligation t o u pdate the information in this Presentation. Important Disclaimers 2
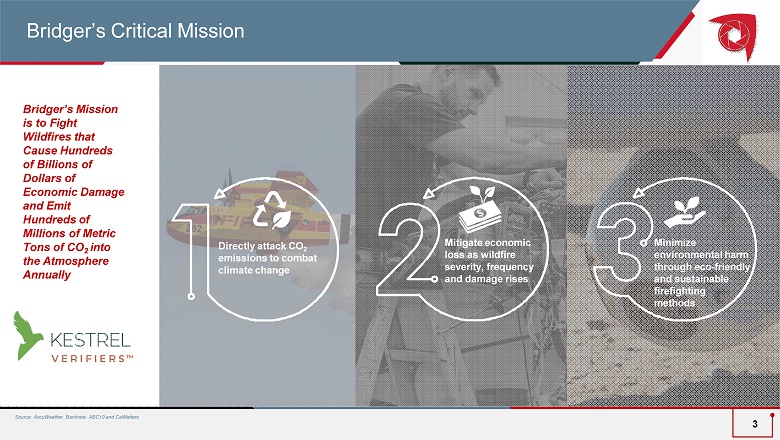
Directly attack CO 2 emissions to combat climate change Minimize environmental harm through eco - friendly and sustainable firefighting methods Mitigate economic loss as wildfire severity, frequency and damage rises Bridger’s Mission is to Fight Wildfires that Cause Hundreds of Billions of Dollars of Economic Damage and Emit Hundreds of Millions of Metric Tons of CO 2 into the Atmosphere Annually Bridger’s Critical Mission Source: AccuWeather, Bankrate, ABC10 and CalMatters. 3
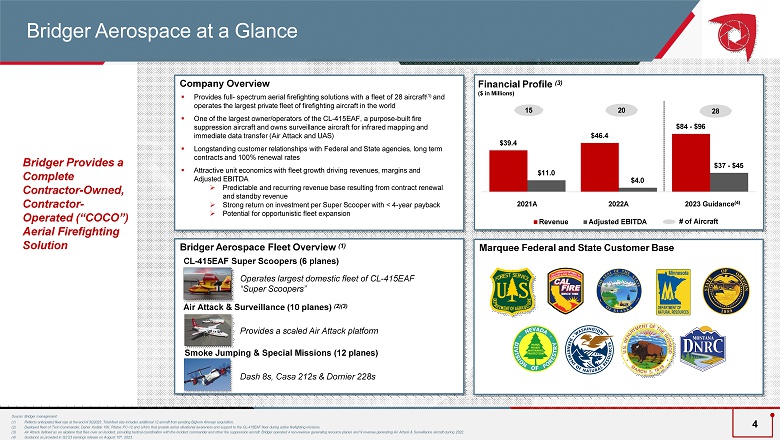
Source: Bridger management. (1) Reflects anticipated fleet size at the end of 3Q2023 .Total fleet size includes additional 12 aircraft from pending Bighorn A irw ays acquisition. (2) Deployed fleet of Twin Commander, Daher Kodiak 100, Pilatus PC - 12 and UAVs that provide aerial situational awareness and support to the CL - 415EAF fleet during active firefighting missions. (3) Air Attack defined as an airplane that flies over an incident, providing tactical coordination with the incident commander and other fire suppression aircraft. Bridger operated 4 non - revenue generating resource planes and 9 revenue generating Air Attack & Surveillance aircraft during 2022 . (4) Guidance as provided in Q2’23 earnings release on August 10 th , 2023 . Bridger Provides a Complete Contractor - Owned, Contractor - Operated (“COCO”) Aerial Firefighting Solution Company Overview Marquee Federal and State Customer Base ▪ Provides full - spectrum aerial firefighting solutions with a fleet of 28 aircraft (1) and operates the largest private fleet of firefighting aircraft in the world ▪ O ne of the largest owner/operators of the CL - 415EAF, a purpose - built fire suppression aircraft and owns surveillance aircraft for infrared mapping and immediate data transfer (Air Attack and UAS) ▪ Longstanding c ustomer r elationships with Federal and State a gencies , l ong t erm c ontracts and 100% r enewal r ates ▪ Attractive u nit e conomics with f leet g rowth driving r evenues , m argins and Adjusted EBITDA » Predictable and recurring revenue base resulting from contract renewal and standby revenue » Strong return on investment per Super Scooper with < 4 - year payback » Potential for opportunistic fleet expansion Bridger Aerospace Fleet Overview (1) CL - 415EAF Super Scoopers (6 planes) Operates largest domestic fleet of CL - 415EAF “Super Scoopers” Air Attack & Surveillance ( 10 planes) (2)(3) Provides a scaled Air Attack platform Smoke Jumping & Special Missions (1 2 planes) Dash 8s, Casa 212s & Dornier 228s Bridger Aerospace at a Glance 15 20 Financial Profile (3) ($ in Millions) $39.4 $46.4 $84 - $96 $11.0 $4.0 $37 - $45 2021A 2022 A 2023 Guidance (4) Revenue Adjusted EBITDA # of Aircraft 28 4
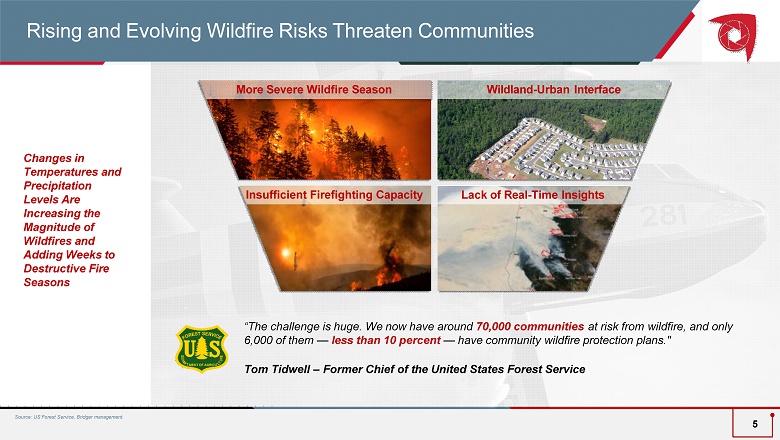
More Severe Wildfire Season Lack of Real - Time Insights “The challenge is huge. We now have around 70,000 communities at risk from wildfire, and only 6,000 of them — less than 10 percent — have community wildfire protection plans. " Tom Tidwell – Former Chief of the United States Forest Service Changes in Temperatures and Precipitation Levels Are Increasing the Magnitude of Wildfires and Adding Weeks to Destructive Fire Seasons Insufficient Firefighting Capacity Wildland - Urban Interface Rising and Evolving Wildfire Risks Threaten Communities Source: US Forest Service, Bridger management. 5

The Canada Wildfires Led to Hazardous Conditions in New York City, Leading to the Highest Air Pollution Levels in the World Rising and Evolving Wildfire Risks Threaten Communities in June 2023 6
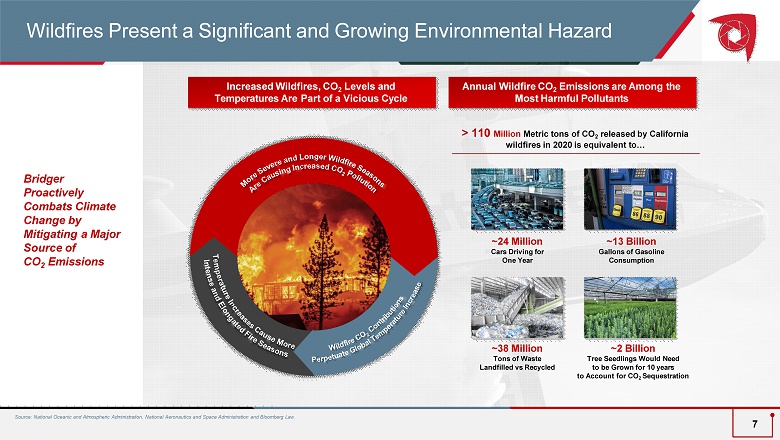
Source: National Oceanic and Atmospheric Administration, National Aeronautics and Space Administration and Bloomberg Law. Increased Wildfires, CO 2 Levels and Temperatures Are Part of a Vicious Cycle Annual Wildfire CO 2 Emissions are Among the Most Harmful Pollutants > 110 Million Metric tons of CO 2 released by California wildfires in 2020 is equivalent to… ~24 Million Cars Driving for One Year ~38 Million Tons of Waste Landfilled vs Recycled ~13 Billion Gallons of Gasoline Consumption ~2 Billion Tree Seedlings Would Need to be Grown for 10 years to Account for CO 2 Sequestration Bridger Proactively Combats Climate Change by Mitigating a Major Source of CO 2 Emissions Wildfires Present a Significant and Growing Environmental Hazard 7
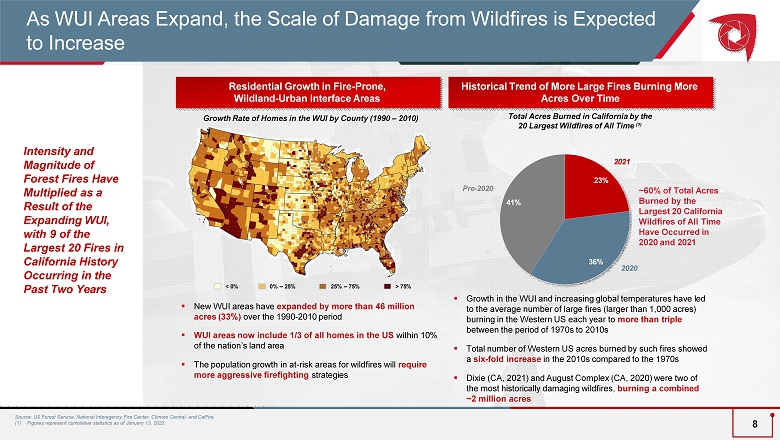
23% 36% 41% 2021 Pre - 2020 ~60% of Total Acres Burned by the Largest 20 California Wildfires of All Time Have Occurred in 2020 and 2021 Residential Growth in Fire - Prone, Wildland - Urban Interface Areas < 0% 0% – 25% 25% – 75% > 75% ▪ New WUI areas have expanded by more than 46 million acres (33%) over the 1990 - 2010 period ▪ WUI areas now include 1/3 of all homes in the US within 10% of the nation’s land area ▪ The population growth in at - risk areas for wildfires will require more aggressive firefighting strategies Growth Rate of Homes in the WUI by County (1990 – 2010) Total Acres Burned in California by the 20 Largest Wildfires of All Time (1) ▪ Growth in the WUI and increasing global temperatures have led to the average number of large fires (larger than 1,000 acres) burning in the Western US each year to more than triple between the period of 1970s to 2010s ▪ Total number of Western US acres burned by such fires showed a six - fold increase in the 2010s compared to the 1970s ▪ Dixie (CA, 2021) and August Complex (CA, 2020) were two of the most historically damaging wildfires, burning a combined ~2 million acres Historical Trend of More Large Fires Burning More Acres Over Time 2020 Intensity and Magnitude of Forest Fires Have Multiplied as a Result of the Expanding WUI, with 9 of the Largest 20 Fires in California History Occurring in the Past Two Years As WUI Areas Expand, the Scale of Damage from Wildfires is Expected to Increase Source: US Forest Service, National Interagency Fire Center, Climate Central, and CalFire. (1) Figures represent cumulative statistics as of January 13, 2022. 8
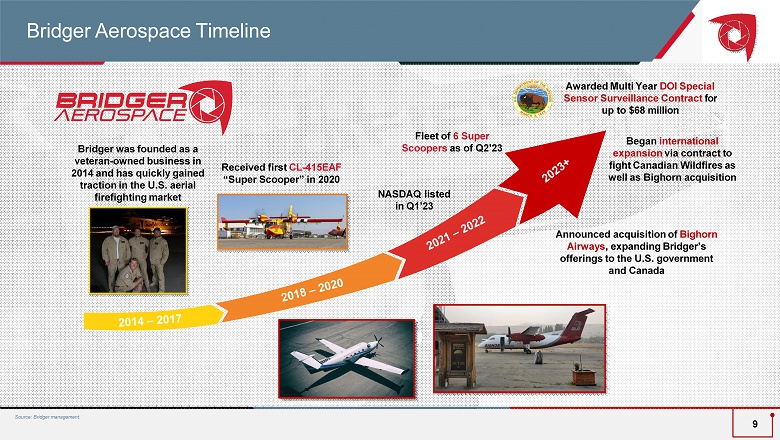
Bridger Aerospace Timeline Bridger was founded as a veteran - owned business in 2014 and has quickly gained traction in the U.S. aerial firefighting market Awarded Multi Year DOI Special Sensor Surveillance Contract for up to $ 68 million NASDAQ listed in Q 1 ’2 3 Fleet of 6 Super Scoopers as of Q 2 ’23 Received first CL - 415EAF “Super Scooper” in 2020 Began international expansion via contract to fight Canadian Wildfires as well as Big h orn acquisition Source: Bridger management. Announced acquisition of Bighorn Airways , expanding Bridger’s offerings to the U.S. government and Canada 9
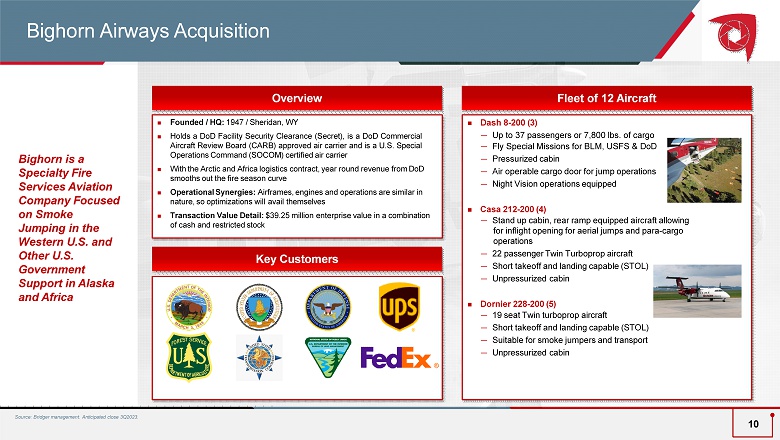
Founded / HQ : 1947 / Sheridan, WY Holds a DoD Facility Security Clearance (Secret), is a DoD Commercial Aircraft Review Board (CARB) approved air carrier and is a U . S . Special Operations Command (SOCOM) certified air carrier With the Arctic and Africa logistics contract, year round revenue from DoD smooths out the fire season curve Operational Synergies: Airframes, engines and operations are similar in nature, so optimizations will avail themselves Transaction Value Detail: $39.25 million enterprise value in a combination of cash and restricted stock Bighorn Airways Acquisition Fleet of 12 Aircraft Overview Bighorn is a S pecialty F ire S ervices A viation C ompany F ocused on S moke J umping in the W estern U.S. and O ther U.S. Government Support in Alaska and Africa Source: Bridger management . Anticipated close 3Q2023. Dash 8 - 2 00 (3) — Up to 37 passengers or 7,800 lbs. of cargo — Fly Special Missions for BLM, USFS & DoD — Pressurized cabin — Air operable cargo door for jump operations — Night Vision operations equipped Casa 212 - 200 (4) — Stand up cabin, rear ramp equipped aircraft allowing for inflight opening for aerial jumps and para - cargo operations — 22 passenger Twin Turboprop aircraft — Short takeoff and landing capable (STOL) — Unpressurized cabin Dornier 228 - 200 (5) — 19 seat Twin turboprop aircraft — Short takeoff and landing capable (STOL) — Suitable for smoke jumpers and transport — Unpressurized cabin Key Customers 10
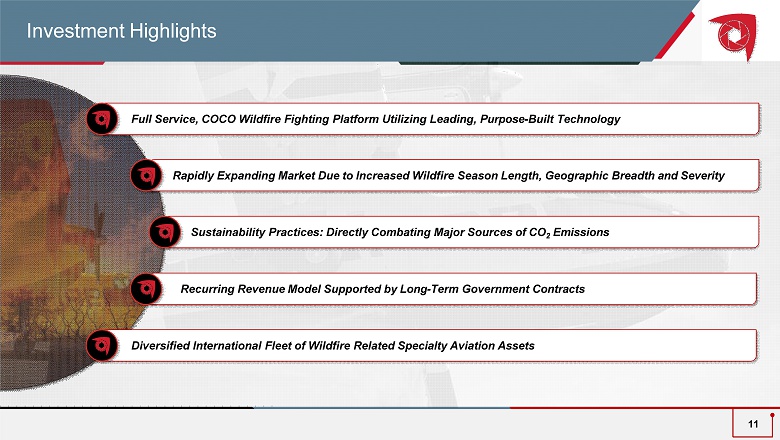
Diversified International Fleet of Wildfire Related Specialty Aviation Assets Recurring Revenue Model Supported by Long - Term Government Contracts Sustainability Practices: Directly Combating Major Sources of CO 2 Emissions Rapidly Expanding Market Due to Increased Wildfire Season Length, Geographic Breadth and Severity Full Service, COCO Wildfire Fighting Platform Utilizing Leading, Purpose - Built Technology Investment Highlights 11
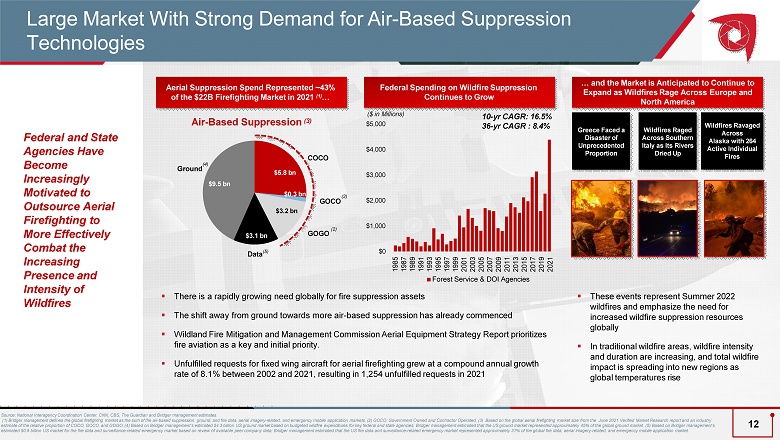
$5.8 bn $0.3 bn $3.2 bn $3.1 bn $9.5 bn Source: National Interagency Coordination Center, CNN, CBS, The Guardian and Bridger management estimates. (1) Bridger management defines the global firefighting market as the sum of the air - based suppression, ground, and fire data, aerial imagery - related, and emergency mobile application markets. (2) GOCO: Government Owned and Contractor Operated , (3) Based on the global aerial firefighting market size from the June 2021 Verified Market Research report and an industry estimate of the relative proportion of COCO, GOCO, and GOGO. (4) Based on Bridger management’s estimated $4.3 billion US ground market based on budgeted wildfire expenditures for key federal and state agencies; Bridger management estimated that the US ground market represented approximately 45% of the global ground market. (5) Based on Bridger management’s estimated $0.9 billion US market for the fire data and surveillance - related emergency market based on review of available peer c ompany data; Bridger management estimated that the US fire data and surveillance - related emergency market represented approximat ely 31% of the global fire data, aerial imagery - related, and emergency mobile application market. Aerial Suppression Spend Represented ~43% of the $22B Firefighting Market in 2021 (1) … (2) (2) … and the Market is Anticipated to Continue to Expand as Wildfires Rage Across Europe and North America ▪ There is a rapidly growing need globally for fire suppression assets ▪ The shift away from ground towards more air - based suppression has already commenced ▪ Wildland Fire Mitigation and Management Commission Aerial Equipment Strategy Report prioritizes fire aviation as a key and initial priority. ▪ Unfulfilled requests for fixed wing aircraft for aerial firefighting grew at a compound annual growth rate of 8.1% between 2002 and 2021, resulting in 1,254 unfulfilled requests in 2021 Federal and State Agencies Have Become Increasingly Motivated to Outsource Aerial Firefighting to More Effectively Combat the Increasing Presence and Intensity of Wildfires Air - Based Suppression (3) Large Market With Strong Demand for Air - Based Suppression Technologies ▪ These events represent Summer 2022 wildfires and emphasize the need for increased wildfire suppression resources globally ▪ In traditional wildfire areas, wildfire intensity and duration are increasing, and total wildfire impact is spreading into new regions as global temperatures rise Greece Faced a Disaster of Unprecedented Proportion Wildfires Ravaged Across Alaska with 264 Active Individual Fires Wildfires Raged Across Southern Italy as Its Rivers Dried Up COCO GOCO GOGO Ground (4) Data (5) Federal Spending on Wildfire Suppression Continues to Grow $0 $1,000 $2,000 $3,000 $4,000 1985 1987 1989 1991 1993 1995 1997 1999 2001 2003 2005 2007 2009 2011 2013 2015 2017 2019 2021 Forest Service & DOI Agencies 10 - yr CAGR: 16.5% 36 - yr CAGR : 8.4% ($ in Millions) $5,000 12
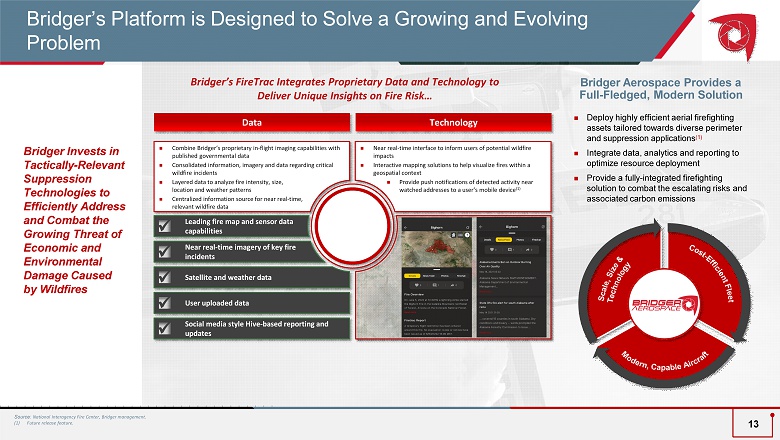
Bridger’s FireTrac Integrates Proprietary Data and Technology to Deliver Unique Insights on Fire Risk… Bridger Invests in Tactically - Relevant Suppression Technologies to Efficiently Address and Combat the Growing Threat of Economic and Environmental Damage Caused by Wildfires Deploy highly efficient aerial firefighting assets tailored towards diverse perimeter and suppression applications (1) Integrate data, analytics and reporting to optimize resource deployment Provide a fully - integrated firefighting solution to combat the escalating risks and associated carbon emissions Bridger Aerospace Provides a Full - Fledged, Modern Solution Bridger’s Platform is Designed to Solve a Growing and Evolving Problem Source: National Interagency Fire Center, Bridger management. (1) Future release feature. 13 Combine Bridger’s proprietary in - flight imaging capabilities with published governmental data Consolidated information, imagery and data regarding critical wildfire incidents Layered data to analyze fire intensity, size, location and weather patterns Centralized information source for near real - time, relevant wildfire data Near real - time interface to inform users of potential wildfire impacts Interactive mapping solutions to help visualize fires within a geospatial context Provide push notifications of detected activity near watched addresses to a user’s mobile device (1) Leading fire map and sensor data capabilities Near real - time imagery of key fire incidents Satellite and weather data Social media style Hive - based reporting and updates User uploaded data Data Technology x x x x x
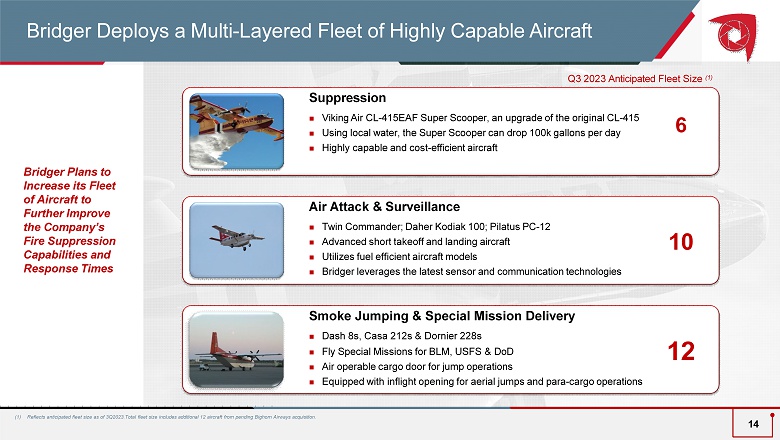
Suppression Viking Air CL - 415EAF Super Scooper, an upgrade of the original CL - 415 Using local water, the Super Scooper can drop 100k gallons per day Highly capable and cost - efficient aircraft Air Attack & Surveillance Twin Commander; Daher Kodiak 100; Pilatus PC - 12 Advanced short takeoff and landing aircraft Utilizes fuel efficient aircraft models Bridger leverages the latest sensor and communication technologies Smoke Jumping & Special Mission Delivery Dash 8s, Casa 212s & Dornier 228s Fly Special Missions for BLM, USFS & DoD Air operable cargo door for jump operations Equipped with inflight opening for aerial jumps and para - cargo operations 6 10 1 2 Bridger Plans to Increase its Fleet of Aircraft to Further Improve the Company’s Fire Suppression Capabilities and Response Times Q3 2023 Anticipated Fleet Size (1) Bridger Deploys a Multi - Layered Fleet of Highly Capable Aircraft (1) Reflects anticipated fleet size as of 3Q2023.Total fleet size includes additional 12 aircraft from pending Bighorn Airways acquisition. 14
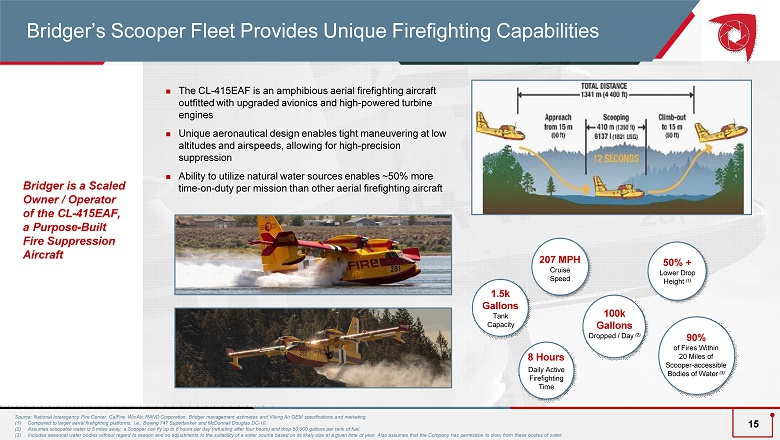
Source: National Interagency Fire Center, CalFire, WinAir, RAND Corporation, Bridger management estimates and Viking Air OEM specifications and marketing. (1) Compared to larger aerial firefighting platforms, i.e., Boeing 747 Supertanker and McDonnell Douglas DC - 10. (2) Assumes scoopable water is 5 miles away; a Scooper can fly up to 8 hours per day (refueling after four hours) and drop 50,000 gallons per tank of fuel. (3) Includes seasonal water bodies without regard to season and no adjustments to the suitability of a water source based on its likely size at a given time of year. Also assumes that the Company has permission to draw from these bodies of water. The CL - 415EAF is an amphibious aerial firefighting aircraft outfitted with upgraded avionics and high - powered turbine engines Unique aeronautical design enables tight maneuvering at low altitudes and airspeeds, allowing for high - precision suppression Ability to utilize natural water sources enables ~50% more time - on - duty per mission than other aerial firefighting aircraft 207 MPH Cruise Speed 8 Hours Daily Active Firefighting Time 1.5k Gallons Tank Capacity 90% of Fires Within 20 Miles of Scooper - accessible Bodies of Water (3) 100k Gallons Dropped / Day (2) 50% + Lower Drop Height (1) Bridger is a Scaled Owner / Operator of the CL - 415EAF, a Purpose - Built Fire Suppression Aircraft Bridger’s Scooper Fleet Provides Unique Firefighting Capabilities 15
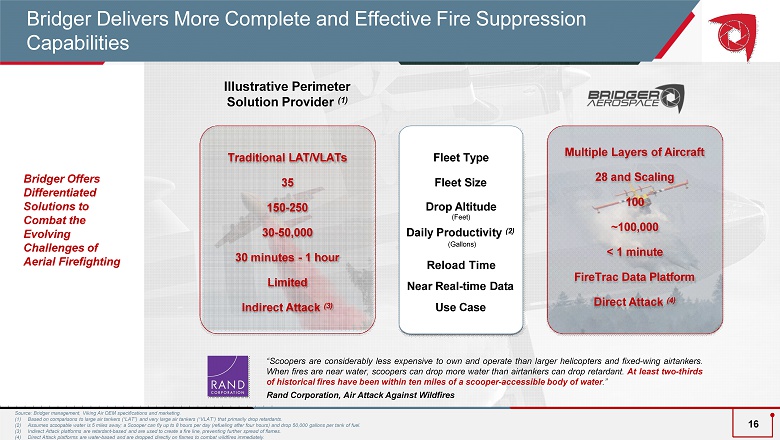
Traditional LAT/VLATs 35 150 - 250 30 - 50,000 30 minutes - 1 hour Limited Indirect Attack (3) “Scoopers are considerably less expensive to own and operate than larger helicopters and fixed - wing airtankers . When fires are near water, scoopers can drop more water than airtankers can drop retardant . At least two - thirds of historical fires have been within ten miles of a scooper - accessible body of water . ” Rand Corporation, Air Attack Against Wildfires Bridger Offers Differentiated Solutions to Combat the Evolving Challenges of Aerial Firefighting Source: Bridger management, Viking Air OEM specifications and marketing. (1) Based on comparisons to large air tankers (“LAT”) and very large air tankers (“VLAT”) that primarily drop retardants. (2) Assumes scoopable water is 5 miles away; a Scooper can fly up to 8 hours per day (refueling after four hours) and drop 50,000 gallons per tank of fuel. (3) Indirect Attack platforms are retardant - based and are used to create a fire line, preventing further spread of flames. (4) Direct Attack platforms are water - based and are dropped directly on flames to combat wildfires immediately. Bridger Delivers More Complete and Effective Fire Suppression Capabilities Multiple Layers of Aircraft 2 8 and Scaling 100 ~100,000 < 1 minute FireTrac Data Platform Direct Attack (4) Illustrative Perimeter Solution Provider (1) ) Fleet Type Fleet Size Daily Productivity (2 ) (Gallons) Near Real - time Data Use Case Drop Altitude (Feet) Reload Time 16
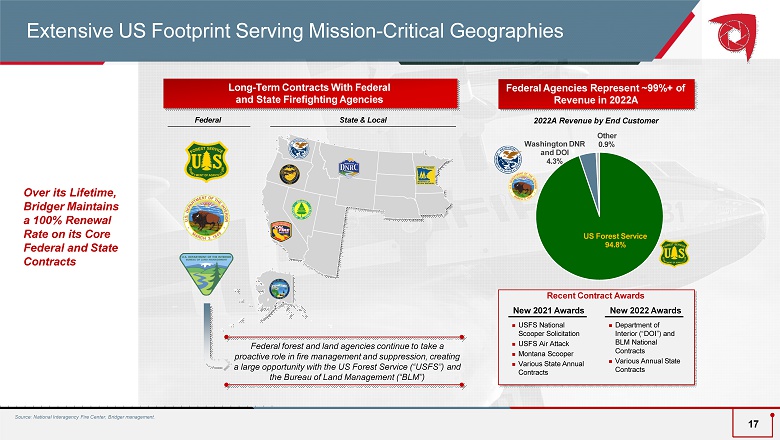
Long - Term Contracts With Federal and State Firefighting Agencies Federal Agencies Represent ~99%+ of Revenue in 2022A New 2021 Awards USFS National Scooper Solicitation USFS Air Attack Montana Scooper Various State Annual Contracts New 2022 Awards Department of Interior (“DOI”) and BLM National Contracts Various Annual State Contracts Recent Contract Awards Federal State & Local Federal forest and land agencies continue to take a proactive role in fire management and suppression, creating a large opportunity with the US Forest Service (“USFS”) and the Bureau of Land Management (“BLM”) Over its Lifetime, Bridger Maintains a 100% Renewal Rate on its Core Federal and State Contracts Source: National Interagency Fire Center, Bridger management. Extensive US Footprint Serving Mission - Critical Geographies US Forest Service 94.8% Washington DNR and DOI 4.3% 2022A Revenue by End Customer Other 0.9% 17
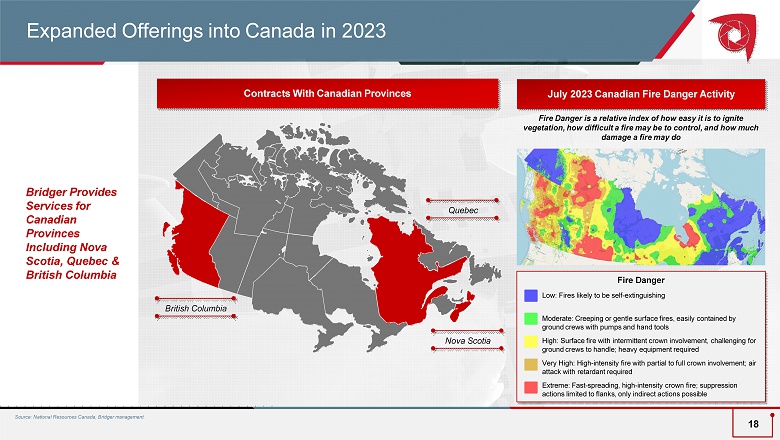
Contracts With Canadian Provinces July 2023 Canadian Fire Danger Activity Bridger Provides Services for Canadian Provinces Including Nova Scotia, Quebec & British Columbia Source: National Resources Canada, Bridger management. Expand ed Offerings into Canada in 2023 Nova Scotia Quebec British Columbia Fire Danger Low: Fires likely to be self - extinguishing Moderate : Creeping or gentle surface fires, easily contained by ground crews with pumps and hand tools High: Surface fire with intermittent crown involvement, challenging for ground crews to handle; heavy equipment required Very High: High - intensity fire with partial to full crown involvement; air attack with retardant required Extreme: Fast - spreading, high - intensity crown fire; suppression actions limited to flanks, only indirect actions possible Fire Danger is a relative index of how easy it is to ignite vegetation, how difficult a fire may be to control, and how much damage a fire may do 18
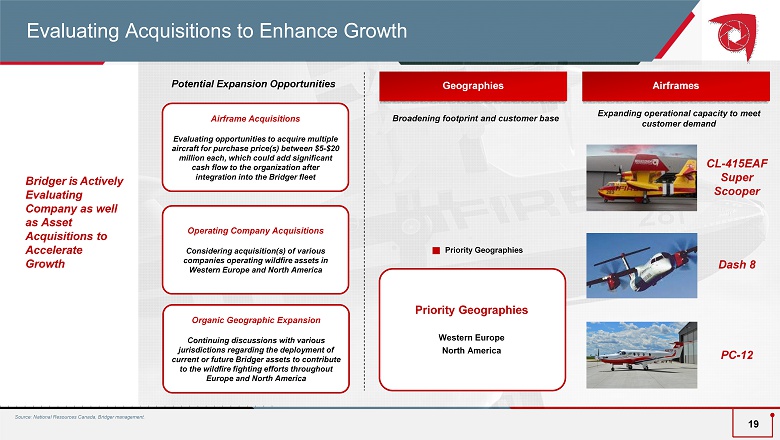
Source: National Resources Canada, Bridger management. Evaluating Acquisitions to Enhance Growth Bridger is Actively Evaluating Company as well as Asset Acquisitions to Accelerate Growth Airframes Expanding operational capacity to meet customer demand Airframe Acquisitions Evaluating opportunities to acquire multiple aircraft for purchase price(s) between $5 - $20 million each, which could add significant cash flow to the organization after integration into the Bridger fleet Operating Company Acquisitions Considering acquisition(s) of various companies operating wildfire assets in Western Europe and North America Organic Geographic Expansion Continuing discussions with various jurisdictions regarding the deployment of current or future Bridger assets to contribute to the wildfire fighting efforts throughout Europe and North America Priority Geographies Priority Geographies Western Europe North America Geographies Broadening footprint and customer base CL - 415EAF Super Scooper Dash 8 PC - 12 Potential Expansion Opportunities 19
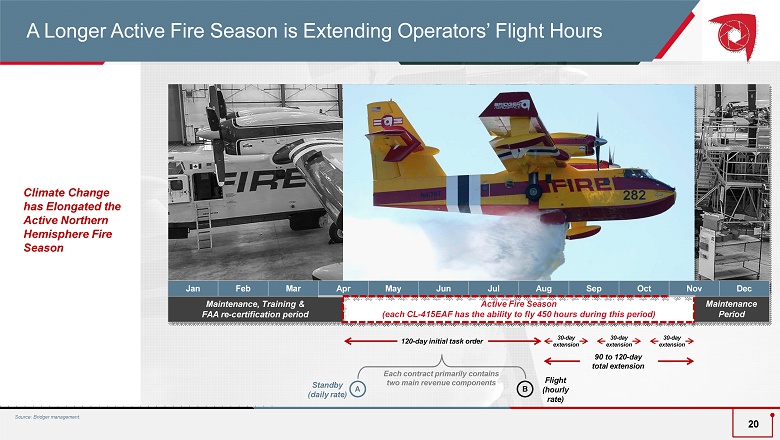
30 - day extension 30 - day extension 90 to 120 - day total extension 30 - day extension 120 - day initial task order Standby (daily rate) Flight (hourly rate) Each contract primarily contains two main revenue components A B Jan Feb Mar Apr May Jun Jul Aug Sep Oct Nov Dec Maintenance, Training & FAA re - certification period Active Fire Season (each CL - 415EAF has the ability to fly 450 hours during this period) Maintenance Period Climate Change has Elongated the Active Northern Hemisphere Fire Season A Longer Active Fire Season is Extending Operators’ Flight Hours Source: Bridger management. 20
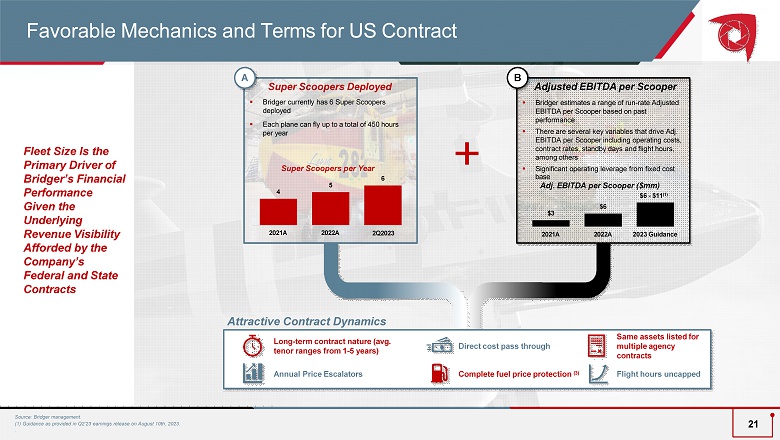
A B Super Scoopers Deployed ▪ Bridger currently has 6 Super Scoopers deployed ▪ Each plane can fly up to a total of 450 hours per year Long - term contract nature (avg. tenor ranges from 1 - 5 years) Annual Price Escalators Direct cost pass through Complete fuel price protection (3) Same assets listed for multiple agency contracts Flight hours uncapped Favorable Mechanics and Terms for US Contract Fleet Size Is the Primary Driver of Bridger’s Financial Performance Given the Underlying Revenue Visibility Afforded by the Company’s Federal and State Contracts Super Scoopers per Year Source: Bridger management . (1 ) Guidance as provided in Q2’23 earnings release on August 10th, 2023. . Attractive Contract Dynamics 4 5 6 2021A 2022A 2Q2023 $3 $6 Adjusted EBITDA per Scooper ▪ Bridger estimates a range of run - rate Adjusted EBITDA per Scooper based on past performance ▪ There are several key variables that drive Adj. EBITDA per Scooper including operating costs, contract rates, standby days and flight hours, among others ▪ Significant operating leverage from fixed cost base Adj. EBITDA per Scooper ($mm) $6 - $ 11 (1) 2021A 2022A 2023 Guidance 21
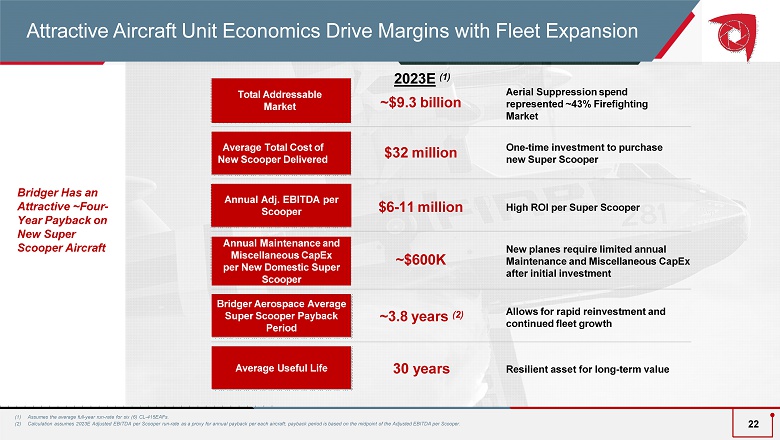
(1) Assumes the average full - year run - rate for six ( 6 ) CL - 415EAFs . (2) Calculation assumes 2023E Adjusted EBITDA per Scooper run - rate as a proxy for annual payback per each aircraft; payback period is based on the midpoint of the Adjusted EBITDA per Scooper. $32 million One - time investment to purchase new Super Scooper Average Total Cost of New Scooper Delivered Bridger Aerospace Average Super Scooper Payback Period ~3.8 years (2) A llows for rapid reinvestment and continued fleet growth Annual Maintenance and Miscellaneous CapEx per New Domestic Super Scooper ~$600K New planes require limited annual Maintenance and Miscellaneous CapEx after initial investment Bridger Has an Attractive ~Four - Year Payback on New Super Scooper Aircraft Attractive Aircraft Unit Economics Drive Margins with Fleet Expansion 2023E (1) ~$9.3 billion Aerial Suppression spend represented ~43% Firefighting Market Total Addressable Market Annual Adj. EBITDA per Scooper $6 - 11 million High ROI per Super Scooper 22 Average Useful Life 30 years Resilient asset for long - term value
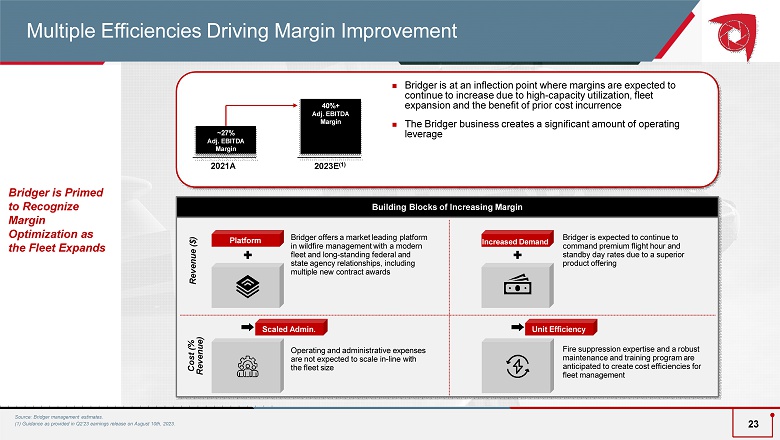
Building Blocks of Increasing Margin Bridger is at an inflection point where margins are expected to continue to increase due to high - capacity utilization, fleet expansion and the benefit of prior cost incurrence The Bridger business creates a significant amount of operating leverage Bridger offers a market leading platform in wildfire management with a modern fleet and long - standing federal and state agency relationships , including multiple new contract awards Bridger is expected to continue to command premium flight hour and standby day rate s due to a superior product offering Operating and administrative expenses are not expected to scale in - line with the fleet size Fire suppression expertise and a robust maintenance and training program are anticipated to create cost efficiencies for fleet management Platform Increased Demand Scaled Admin. Unit Efficiency ~27% Adj. EBITDA Margin 2021A 2023E (1) Revenue ($) 40%+ Adj. EBITDA Margin Cost (% Revenue) Multiple Efficiencies Driving Margin Improvement Bridger is Primed to Recognize Margin Optimization as the Fleet Expands Source: Bridger management estimates . (1) Guidance as provided in Q2’23 earnings release on August 10th, 2023. 23
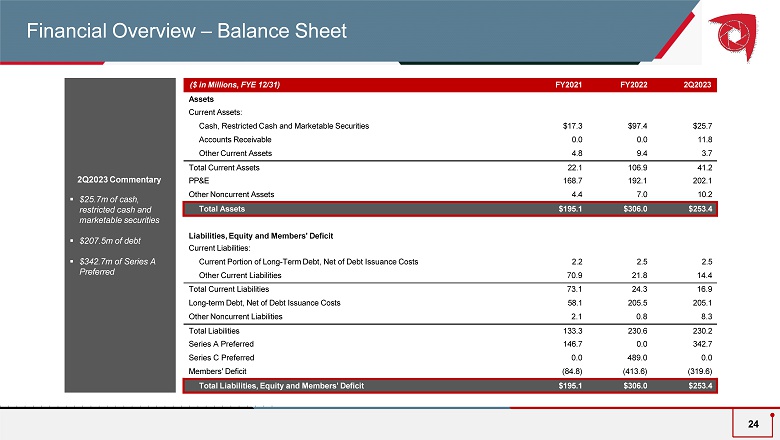
Financial Overview – Balance Sheet 24 2 Q2023 Commentary ▪ $ 25.7 m of cash, restricted cash and marketable securities ▪ $207.5m of debt ▪ $342.7m of Series A Preferred ($ in Millions , FYE 12/31) FY2021 FY2022 2 Q2023 Assets Current Assets: Cash, Restricted Cash and Marketable Securities $17.3 $97.4 $25.7 Accounts Receivable 0.0 0.0 11.8 Other Current Assets 4.8 9.4 3.7 Total Current Assets 22.1 106.9 41.2 PP&E 168.7 192.1 202.1 Other Noncurrent Assets 4.4 7.0 10.2 Total Assets $195.1 $306.0 $ 2 53.4 Liabilities, Equity and Members' Deficit Current Liabilities: Current Portion of Long - Term Debt, Net of Debt Issuance Costs 2.2 2.5 2.5 Other Current Liabilities 70.9 21.8 14.4 Total Current Liabilities 73.1 24.3 16.9 Long - term Debt, Net of Debt Issuance Costs 58.1 205.5 205.1 Other Noncurrent Liabilities 2.1 0.8 8.3 Total Liabilities 133.3 230.6 230. 2 Series A Preferred 146.7 0.0 342.7 Series C Preferred 0.0 489.0 0.0 Members' Deficit (84.8) ( 41 3.6 ) ( 319.6 ) Total Liabilities, Equity and Members' Deficit $195.1 $306.0 $253.4